. 2000 Jun 12;149(6):1249-62.
doi: 10.1083/jcb.149.6.1249.

The tyrosine kinase PYK-2/RAFTK regulates natural killer (NK) cell cytotoxic response, and is translocated and activated upon specific target cell recognition and killing

Affiliations

The tyrosine kinase PYK-2/RAFTK regulates natural killer (NK) cell cytotoxic response, and is translocated and activated upon specific target cell recognition and killing

D Sancho et al. J Cell Biol. .

Abstract

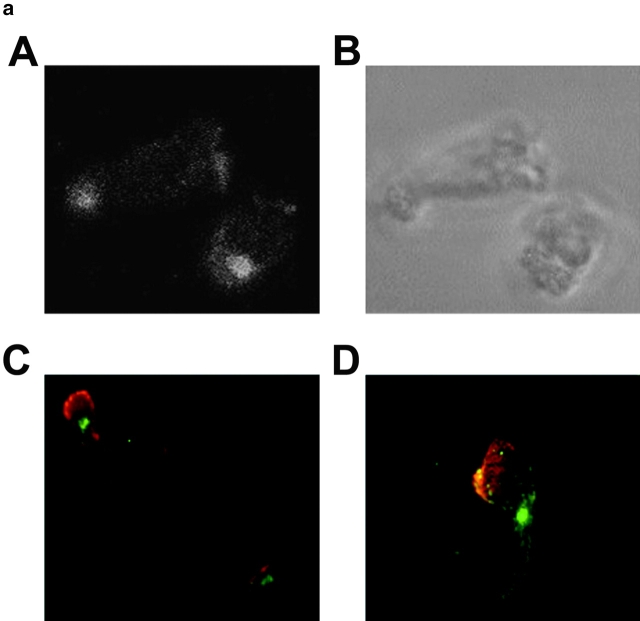
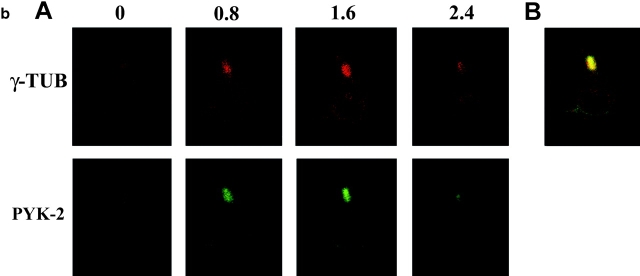
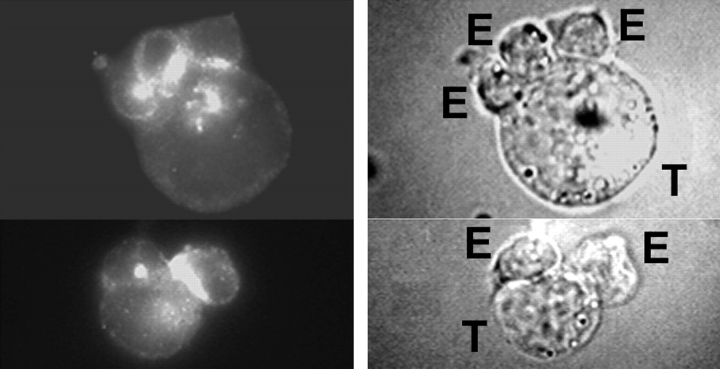
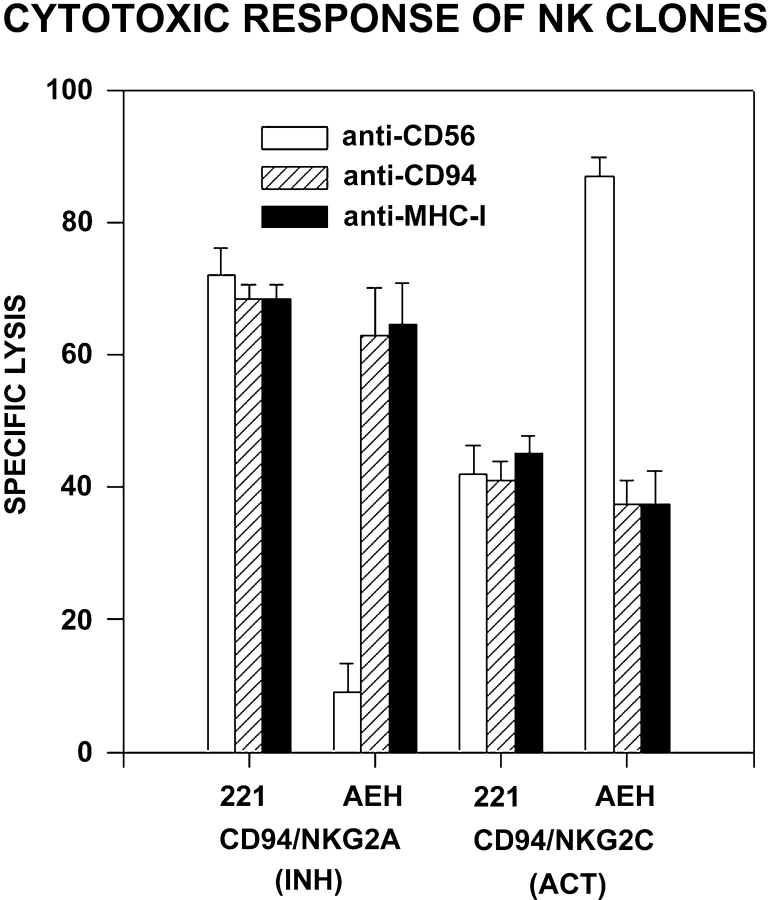
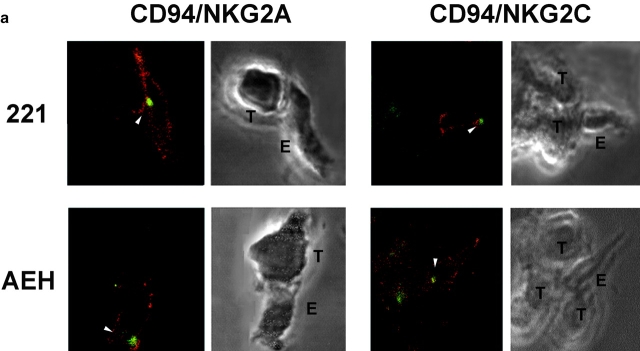
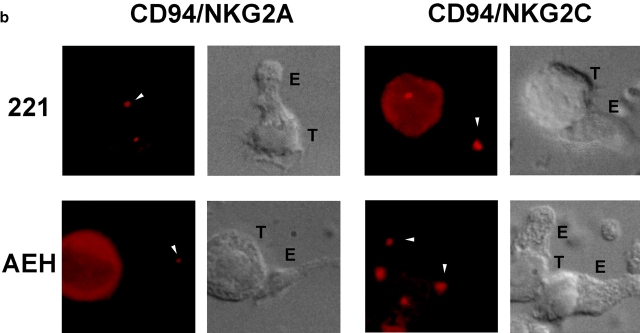
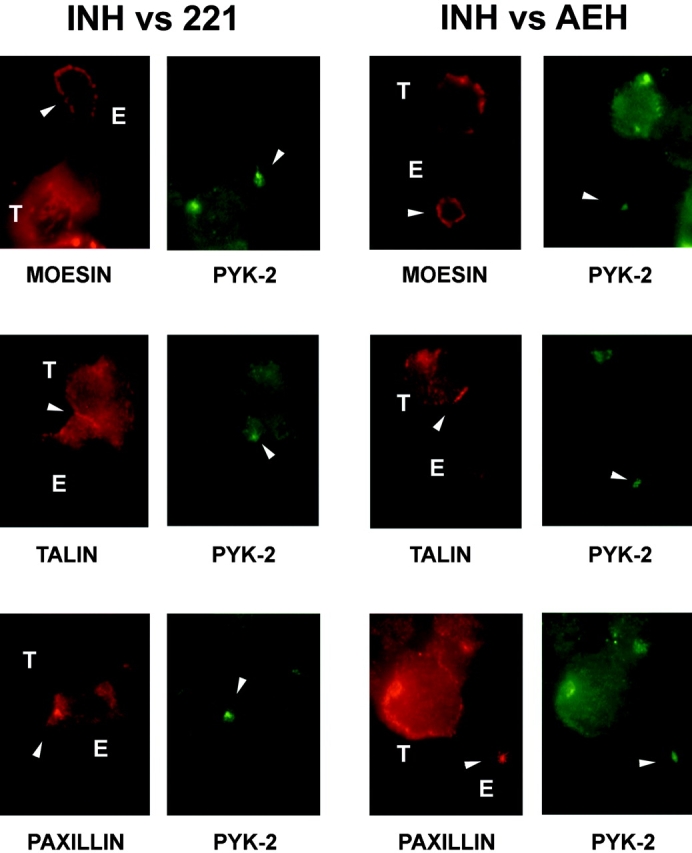
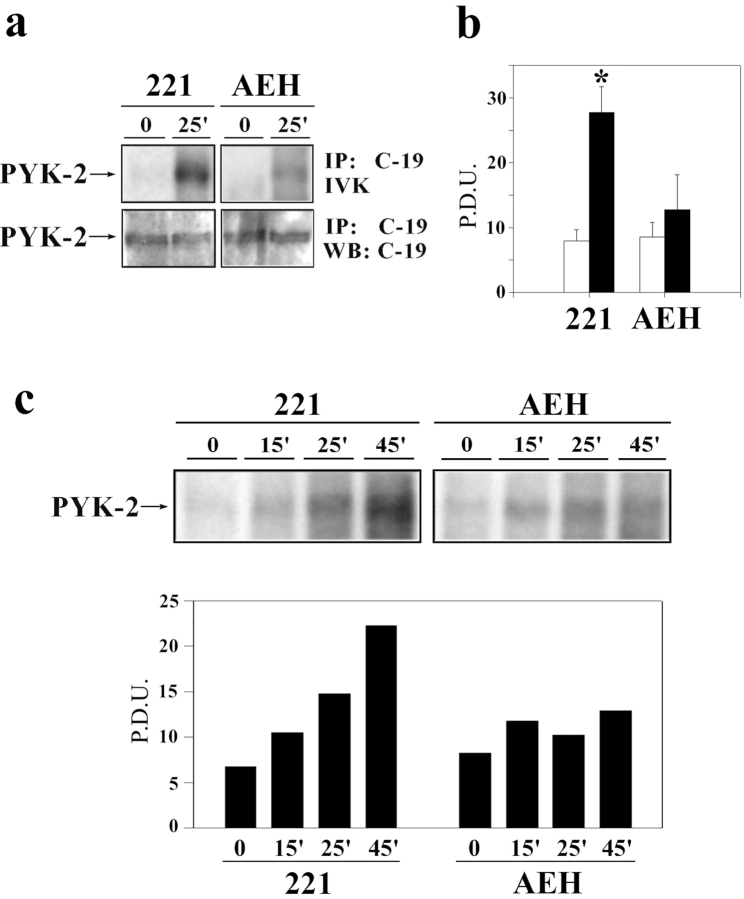
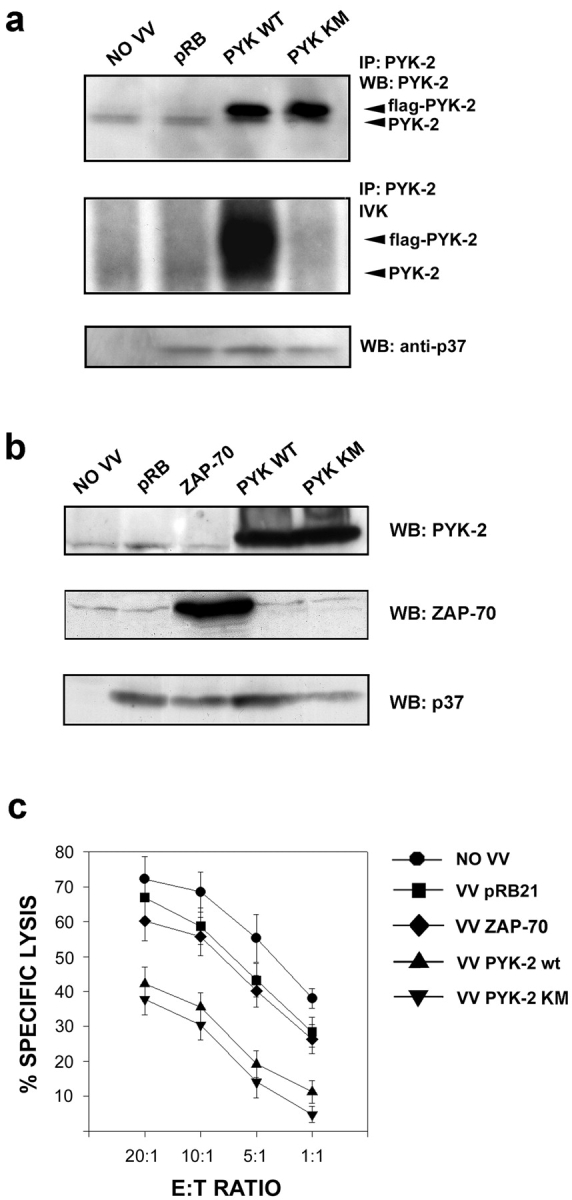
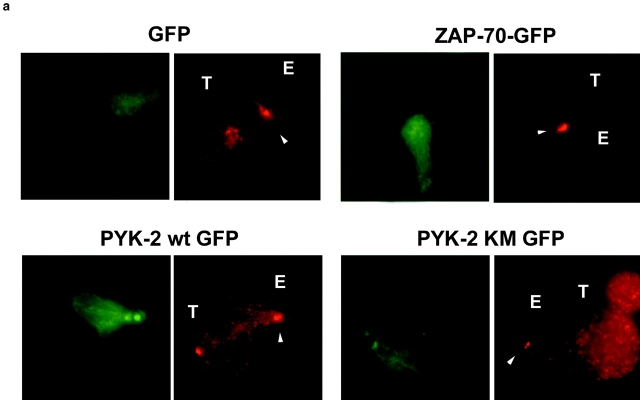
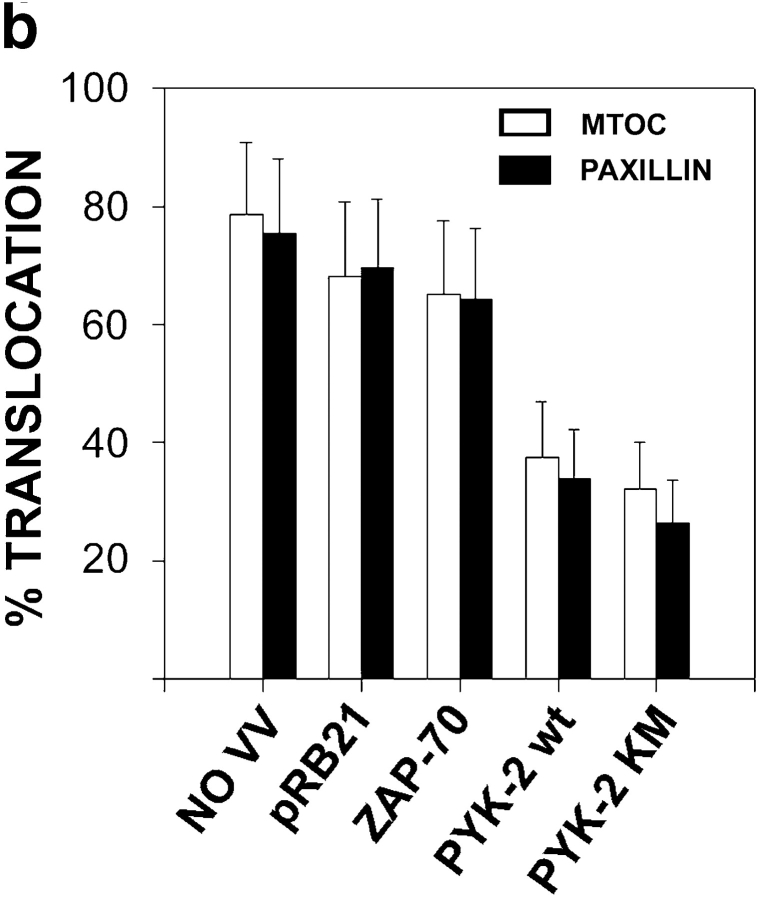
The compartmentalization of plasma membrane proteins has a key role in regulation of lymphocyte activation and development of immunity. We found that the proline-rich tyrosine kinase-2 (PYK-2/RAFTK) colocalized with the microtubule-organizing center (MTOC) at the trailing edge of migrating natural killer (NK) cells. When polyclonal NK cells bound to K562 targets, PYK-2 translocated to the area of NK-target cell interaction. The specificity of this process was assessed with NK cell clones bearing activatory or inhibitory forms of CD94/NKG2. The translocation of PYK-2, MTOC, and paxillin to the area of NK-target cell contact was regulated upon specific recognition of target cells through NK cell receptors, controlling target cell killing. Furthermore, parallel in vitro kinase assays showed that PYK-2 was activated in response to signals that specifically triggered its translocation and NK cell mediated cytotoxicity. The overexpression of both the wt and a dominant-negative mutant of PYK-2, but not ZAP-70 wt, prevented the specific translocation of the MTOC and paxillin, and blocked the cytotoxic response of NK cells. Our data indicate that subcellular compartmentalization of PYK-2 correlates with effective signal transduction. Furthermore, they also suggest an important role for PYK-2 on the assembly of the signaling complexes that regulate the cytotoxic response.


Figures

Figure 1
Figure 1
PYK-2 is localized at the uropod projection of NK cells adhered to fibronectin. (a) Confocal section of PYK-2 immune staining of NK cells migrating on FN (A). The same section under brightfield illumination is shown in B. Epifluorescence images of NK cells double-stained for PYK-2 (green) and moesin (red, C), and PYK-2 (green) and talin (red, D). Control cells stained with goat serum or secondary antibody alone did not show any specific staining, and preincubation of the anti-PYK-2 antiserum with its specific blocking peptide prevented staining of NK cells (not shown). (b, A) Confocal serial sections of polarized NK cells adhered to FN and double-stained for γ-tubulin (red, upper panels, γ-TUB) and PYK-2 (green, lower panels, PYK-2). Sections were taken every 0.8 μm from the substratum (0) in the z-axis. b, B shows a merged image of double-labeled cells demonstrating the colocalization of γ-tubulin and PYK-2 at the uropod of NK cells.
Figure 1
Figure 1
PYK-2 is localized at the uropod projection of NK cells adhered to fibronectin. (a) Confocal section of PYK-2 immune staining of NK cells migrating on FN (A). The same section under brightfield illumination is shown in B. Epifluorescence images of NK cells double-stained for PYK-2 (green) and moesin (red, C), and PYK-2 (green) and talin (red, D). Control cells stained with goat serum or secondary antibody alone did not show any specific staining, and preincubation of the anti-PYK-2 antiserum with its specific blocking peptide prevented staining of NK cells (not shown). (b, A) Confocal serial sections of polarized NK cells adhered to FN and double-stained for γ-tubulin (red, upper panels, γ-TUB) and PYK-2 (green, lower panels, PYK-2). Sections were taken every 0.8 μm from the substratum (0) in the z-axis. b, B shows a merged image of double-labeled cells demonstrating the colocalization of γ-tubulin and PYK-2 at the uropod of NK cells.
Figure 2
Figure 2
PYK-2 is localized at the intercellular contact area of NK–K562 target cell conjugates. Effector–target cell conjugates of polyclonal NK cells (E) and K562 target cells (T) were stained for PYK-2. Cells were photographed under epifluorescence conditions (left) or phase contrast illumination (right).
Figure 3
Figure 3
Cytotoxic response of NKG2A+ and NKG2C+ NK cell clones against .221 or .221-AEH cells. NK cell clones whose killing activity is inhibited (NKG2A+) or activated (NKG2C+) by HLA-E were tested in a 51Cr-release assay against .221 (HLA-E) or .221-AEH (HLA-E+) target cells. This figure also shows the effect of anti-CD94 HP3B1, anti–MHC class I 1F7, and anti-CD56 C218 (control) mAbs, on the cytotoxic response. Representative data from three independent experiments are shown as arithmetic mean ± SE.
Figure 4
Figure 4
PYK-2 and the MTOC are translocated to the area of cell–cell contact of NK cells with target cells during specific recognition and cytotoxicity. (a) Confocal sections showing PYK-2 localization on NK cell clones (E) which are inhibited (CD94/NKG2A), or activated (CD94/NKG2C) by HLA-E, and that were interacting with HLA-E (.221) or HLA-E+ (AEH) target cells (T). Cell–cell conjugates were stained for PYK-2 (green) and CD94 (red) and analyzed using confocal microscopy. Confocal sections under brightfield illumination are shown for each conjugate. Arrowheads show the localization of PYK-2 on effector cells. (b) MTOC localization on NK cell clones that are inhibited (CD94/NKG2A), or activated (CD94/NKG2C) by HLA-E, and that were interacting with HLA-E (.221) or HLA-E+ (AEH) target cells. Cell conjugates stained for γ-tubulin were photographed under epifluorescence (red) and brightfield conditions using a Nomarski 60× objective. T and E indicate target and effector cells, respectively, while arrowheads point to the MTOC on effector cells.
Figure 4
Figure 4
PYK-2 and the MTOC are translocated to the area of cell–cell contact of NK cells with target cells during specific recognition and cytotoxicity. (a) Confocal sections showing PYK-2 localization on NK cell clones (E) which are inhibited (CD94/NKG2A), or activated (CD94/NKG2C) by HLA-E, and that were interacting with HLA-E (.221) or HLA-E+ (AEH) target cells (T). Cell–cell conjugates were stained for PYK-2 (green) and CD94 (red) and analyzed using confocal microscopy. Confocal sections under brightfield illumination are shown for each conjugate. Arrowheads show the localization of PYK-2 on effector cells. (b) MTOC localization on NK cell clones that are inhibited (CD94/NKG2A), or activated (CD94/NKG2C) by HLA-E, and that were interacting with HLA-E (.221) or HLA-E+ (AEH) target cells. Cell conjugates stained for γ-tubulin were photographed under epifluorescence (red) and brightfield conditions using a Nomarski 60× objective. T and E indicate target and effector cells, respectively, while arrowheads point to the MTOC on effector cells.
Figure 5
Figure 5
Subcellular localization of different cytoskeletal proteins in NK/target cell conjugates. Cytoplasmic localization of PYK-2 (green) and the cytoskeletal proteins moesin, talin, and paxillin (red) in cell conjugates formed by NK cell clones (E) which are inhibited by HLA-E+ (INH-AEH) but not by HLA-E (INH-.221) target cells (T). Arrowheads indicate staining of the protein indicated at each panel.
Figure 6
Figure 6
PYK-2 activation during the cytotoxic response. (a) NKL cells bearing the inhibitory CD94/NKG2A receptor were allowed to interact with HLA-E (.221) or HLA-E+ (AEH) target cells for 25 min and then, half of the lysate was used to immunoprecipitate PYK-2 with the C-19 antibody and to perform an in vitro kinase reaction, and the other half to quantify the levels of PYK-2 by Western blot. Arrows indicate bands corresponding to PYK-2. (b) Statistical analysis of PYK-2 activation. The results of in vitro kinase assays performed as indicated in panel a are expressed as arithmetic mean ± SE of intensity expressed in pixel density units (P.D.U.) and represent three independent experiments. *, P < 0.05 compared to the other times and treatments (Student's t test). (c) Kinetics of the phosphorylating activity of PYK-2. NKL cells bearing the inhibitory CD94/NKG2A receptor were allowed to form conjugates with .221 or .221-AEH cells for different periods of time. Then, an in vitro kinase reaction was performed in cell lysates, as described in Materials and Methods. A representative experiment out of three is shown in the upper panel, whereas the mean intensity in P.D.U. of this experiment is depicted in the lower panel.
Figure 7
Figure 7
Overexpression of PYK-2 wt and PYK-2 (K-M) inhibits NK cells cytotoxic response. (a) Lysates from NKL cells uninfected (NO VV), infected with control vaccinia virus (pRB), infected with PYK-2 wt (PYK WT), or infected with PYK-2 (K-M) (PYK KM) were immunoprecipitated (IP) with C-19 anti–PYK-2 polyclonal antibody, analyzed by Western blotting (WB) with anti–PYK-2 polyclonal antibody, and parallel samples were assayed for in vitro autokinase activity. Whole cell lysates of these samples were analyzed by Western blotting with anti-p37 15B6 mAb. (b) Lysates from NKL cells uninfected (NO VV), infected with control vaccinia virus (pRB), infected with ZAP-70 (ZAP-70), infected with PYK-2 wt (PYK WT), or infected with PYK-2 (K-M) (PYK KM) were analyzed by Western blotting (WB) with C-19 anti–PYK-2 polyclonal antibody, 701 anti–ZAP-70 polyclonal antibody, and 15B6 anti-p37 mAb. (c) NKL cells uninfected (NO VV), infected with control VV (VVpRB21), infected with ZAP-70 (VV ZAP-70), infected with PYK-2 wt (VV PYK-2 wt), or infected with PYK-2 (K-M) (VV PYK-2 KM) were tested in a 51Cr-release assay against their sensitive target .221. Representative data from three independent experiments are shown as the mean percent specific lysis versus E/T ratio. The inhibition of cytotoxic response by overexpression of PYK-2 is significant (P < 0.05, Student's t test) for all E/T ratios tested.
Figure 8
Figure 8
Overexpression of PYK-2 wt-EGFP and PYK-2 (K-M)-EGFP prevents the translocation of MTOC and paxillin during specific target recognition. (a) NK inhibitory clones were infected with control VV-pRB21-EGFP (EGFP) (upper left panels), ZAP-70-EGFP (upper right panels), PYK-2 wt-EGFP (lower left panels), and PYK-2 (K-M)-EGFP (lower right panels). NK cell conjugates with the sensitive .221 target were studied by immunofluorescence. EGFP green fluorescence shows the infected NK cells (left panels). The red fluorescence corresponds to γ-tubulin (MTOC) staining (right panels). T and E indicate target and effector cells, respectively, while arrowheads point to the MTOC on effector cells. (b) Quantification of the translocation of MTOC and paxillin in conjugates formed by a green (infected) NK cell from inhibitory clones and its sensitive target .221. Translocation of MTOC or paxillin was measured in >100 conjugates in three independent experiments. Results correspond to the arithmetic mean ± SD.
Figure 8
Figure 8
Overexpression of PYK-2 wt-EGFP and PYK-2 (K-M)-EGFP prevents the translocation of MTOC and paxillin during specific target recognition. (a) NK inhibitory clones were infected with control VV-pRB21-EGFP (EGFP) (upper left panels), ZAP-70-EGFP (upper right panels), PYK-2 wt-EGFP (lower left panels), and PYK-2 (K-M)-EGFP (lower right panels). NK cell conjugates with the sensitive .221 target were studied by immunofluorescence. EGFP green fluorescence shows the infected NK cells (left panels). The red fluorescence corresponds to γ-tubulin (MTOC) staining (right panels). T and E indicate target and effector cells, respectively, while arrowheads point to the MTOC on effector cells. (b) Quantification of the translocation of MTOC and paxillin in conjugates formed by a green (infected) NK cell from inhibitory clones and its sensitive target .221. Translocation of MTOC or paxillin was measured in >100 conjugates in three independent experiments. Results correspond to the arithmetic mean ± SD.

Similar articles

Cited by

References

    1. Andreev J., Simon J., Sabatini D.D., Kam J., Plowman G., Randazzo P.A., Schlessinger J. Identification of a new PYK-2 target protein with Arf-GAP activity. Mol. Cell. Biol. 1999;19:2338–2350. - PMC - PubMed
    1. Aramburu J., Balboa M.A., Ramírez A., Silva A., Acevedo A., Sánchez-Madrid F., de Landázuri M.O., López-Botet M. A novel functional cell surface dimer (Kp43) expressed by natural killer cells and T cell receptor-γδ T lymphocytes. Inhibition of IL-2 dependent proliferation by anti-Kp43 monoclonal antibody. J. Immunol. 1990;147:714–721. - PubMed
    1. Astier A., Avraham H., Manie S.N., Groopman J., Canty T., Avraham S., Freedman A.S. The related adhesion focal tyrosine kinase is tyrosine phosphorylated after β1-integrin stimulation in B cells and binds to p130cas . J. Biol. Chem. 1997;272:228–232. - PubMed
    1. Avraham S., London R., Fu Y., Ota S., Hiregowdara D., Li S., Jiang S., Pasztor L.M., White R.A., Groopman J.E., Avraham H. Identification and characterization of a novel related adhesion focal tyrosine kinase (RAFTK) from megakaryocytes and brain. J. Biol. Chem. 1995;270:27742–27751. - PubMed
    1. Berg N.N., Ostergaard H.L. T cell receptor engagement induces tyrosine phosphorylation of FAK and PYK-2 and their association with Lck. J. Immunol. 1997;159:1753–1757. - PubMed

Publication types

MeSH terms