. 2000 Jun;12(6):837-51.
doi: 10.1105/tpc.12.6.837.

A shaker-like K(+) channel with weak rectification is expressed in both source and sink phloem tissues of Arabidopsis

Affiliations

A shaker-like K(+) channel with weak rectification is expressed in both source and sink phloem tissues of Arabidopsis

B Lacombe et al. Plant Cell. 2000 Jun.

Abstract

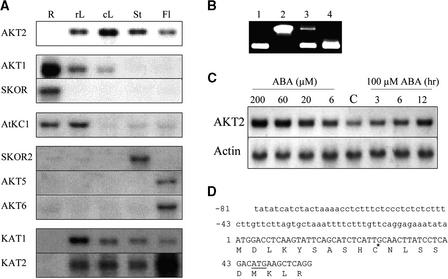
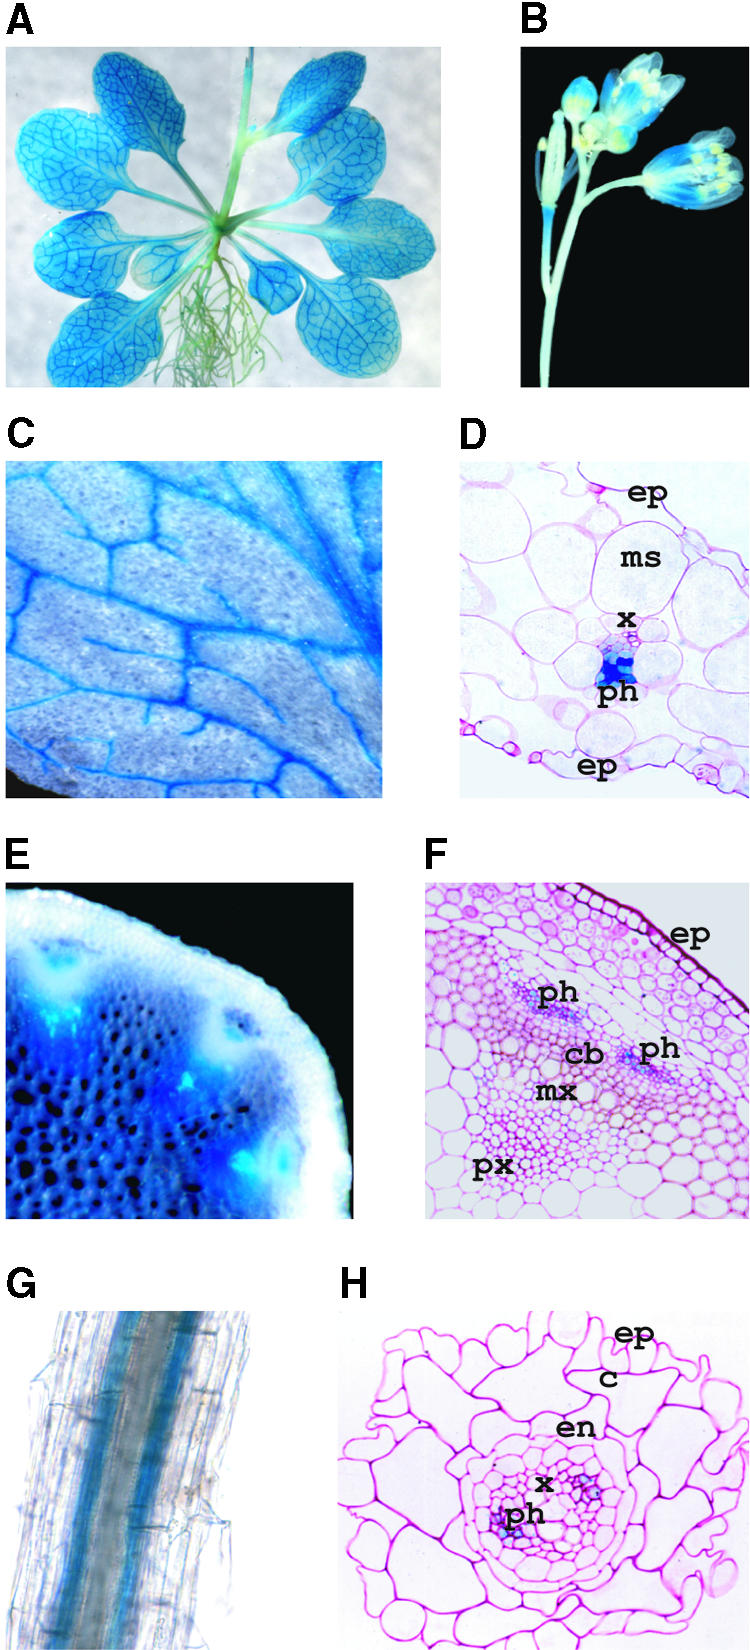
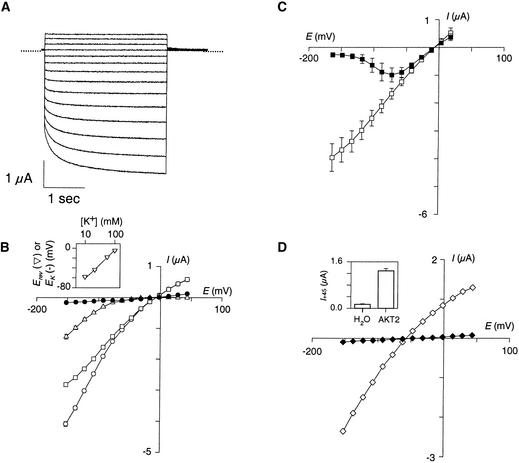
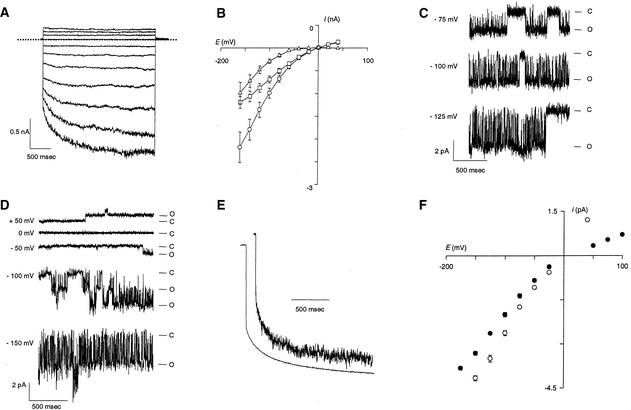
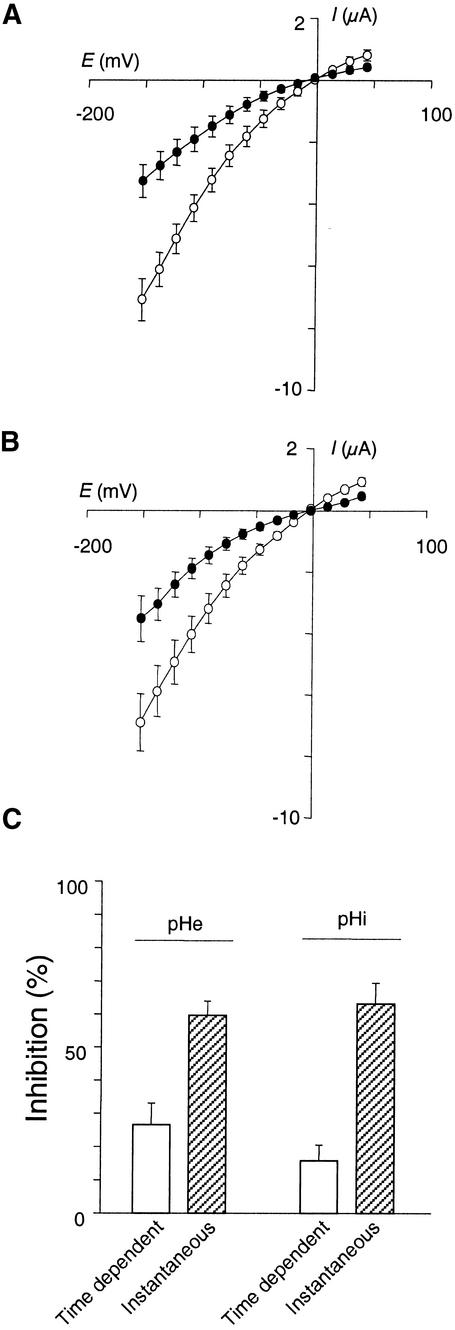
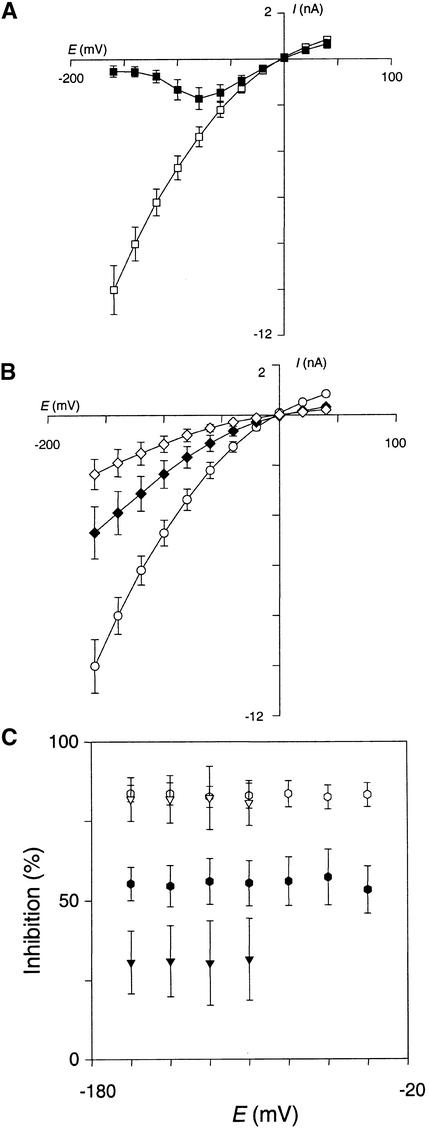
RNA gel blot and reverse transcription-polymerase chain reaction experiments were used to identify a single K(+) channel gene in Arabidopsis as expressed throughout the plant. Use of the beta-glucuronidase reporter gene revealed expression of this gene, AKT2/AKT3, in both source and sink phloem tissues. The AKT2/AKT3 gene corresponds to two previously identified cDNAs, AKT2 (reconstructed at its 5' end) and AKT3, the open reading frame of the latter being shorter at its 5' end than that of the former. Rapid amplification of cDNA ends with polymerase chain reaction and site-directed mutagenesis was performed to identify the initiation codon for AKT2 translation. All of the data are consistent with the hypothesis that the encoded polypeptide corresponds to the longest open reading frame previously identified (AKT2). Electrophysiological characterization (macroscopic and single-channel currents) of AKT2 in both Xenopus oocytes and COS cells revealed a unique gating mode and sensitivity to pH (weak inward rectification, inhibition, and increased rectification upon internal or external acidification), suggesting that AKT2 has enough functional plasticity to perform different functions in phloem tissue of source and sink organs. The plant stress hormone abscisic acid was shown to increase the amount of AKT2 transcript, suggesting a role for the AKT2 in the plant response to drought.


Figures

Figure 1.
Figure 1.
Expression of Akt2 and Other Channel Genes in the Plant, Effect of ABA on AKT2 Transcript Accumulation, and 5′ Sequence of the Identified AKT2 cDNA. (A) Ten micrograms of total RNA, extracted from roots (R), rosette leaves (rL), caulinary leaves (cL), stems (St), or flowers and developing siliques (Fl) of 5-week-old Arabidopsis plants (ecotype Columbia), was fractionated according to size on agarose gel, transferred to a nylon membrane, and hybridized with a 32P-labeled DNA probe corresponding to the AKT2, AKT1, SKOR, AtKC1, KAT1, and KAT2 cDNAs or to the SKOR2 (bacterial artificial chromosome [BAC] MPA22; GenBank accession number AB025630), AKT5 (BAC F3N11; GenBank accession number AC006053), and AKT6 (BAC F8B4; GenBank accession number AL034567) genes. Exposure times were 24 hr (AKT2), 48 hr (AKT1 and SKOR), 3 days (AtKC1), 5 days (SKOR2, AKT5, and AKT6), and 7 to 8 days (KAT1 and KAT2). All gel blot analyses were performed in simultaneous experiments, with an identical aliquot (10 μg) from the same RNA preparation being loaded in each lane. Actin controls (data not shown) confirmed that the gels were identically loaded. (B) RT-PCR experiments. Forty-five PCR cycles were performed with the following templates: 10 ng of cDNA (lane 1), 50 ng of genomic DNA (lane 2), and 1 μL from 50 μL of RT product obtained from 10 μg of root (lane 3) or leaf (lane 4) total RNA. The upper band in lane 3 corresponds to amplification of some genomic DNA contaminating the RNA preparation. (C) RNA gel blot analysis of AKT2 gene expression in leaves in response to ABA added into the culture medium. Lanes labeled ABA (μM) correspond to 6, 20, 60, or 200 μM ABA added 24 hr before leaves were collected for RNA extraction. Lane C (control) corresponds to no ABA treatment. Lanes labeled 100 μM ABA (hr) correspond to 100 μM ABA added 3, 6, or 12 hr before leaves were collected. The membrane was successively hybridized with probes corresponding to AKT2 cDNA and ACT4 actin gene (Nairn et al., 1988). (D) Nucleotide and deduced amino acid sequences from the 5′ region of AKT2 cDNA clone. Numbers refer to distance from the first ATG of the AKT2 cDNA clone. The 5′ untranslated region is in lowercase letters, and the coding sequence is in uppercase letters. The first ATG codon (position 1) is designated as the translational start site. The star at position 30 and the underlined ATG codon at position 46 indicate the respective positions of the transcriptional and translational start sites proposed in AKT3 cDNA by Ketchum and Slayman (1996).
Figure 2.
Figure 2.
Localization of AKT2 Promoter Activity in Arabidopsis Transgenic Plants. (A) Three-week-old plant. (B) Flowers. (C) and (D) Leaf magnification (C) and 3-μm-thick cross-section (D) showing staining in the phloem cells. (E) and (F) Hand-cut (E) and 3-μm-thick (F) cross-sections of stem. (G) and (H) Root magnification (G) and cross-section (H), showing GUS activity in the phloem cells. GUS staining was performed on excised organs of in vitro–grown plantlets, except in (E) and (F), which present plants grown in soil. c, cortex; cb, cambium; en, endodermis; ep, epidermis; ms, mesophyll; mx, metaxylem; ph, phloem; px, protoxylem; x, xylem.
Figure 3.
Figure 3.
Functional Expression of AKT2 Channels in Xenopus Oocytes Assessed by Two-Electrode Voltage–Clamp. (A) AKT2 currents elicited in a 100 mM K+ external solution by 3-sec voltage pulses from +45 to –150 mV (–15 mV steps, 0 mV holding potential, 0 current level are indicated by dotted lines). (B) I/V plots from records obtained in a 100 mM K+ external solution: steady state current sampled at the end of the 3-sec pulses (open circles), instantaneous current sampled at the beginning of the pulses (open squares), and time-dependent current determined as the difference between these two components (open triangles). The closed circles represent the steady state current from H2O-injected oocytes. All data are mean ±se from nine oocytes. The inset shows the reversal potential of AKT2 current (Erev, inverted triangles) as a function of external K+ concentration (mean ±se; formula image); the line represents the K+ Nernst potential (EK). (C) I/V plots of the AKT2 instantaneous current in a 100 mM K+ external solution in the absence (open squares) or in the presence (closed squares) of 10 mM Cs+ (mean ±se; formula image). (D) I/V plot of the steady state current (sampled at the end of the 3-sec pulses) in a 10 mM K+ external solution (AKT2-injected oocyte, open diamonds; H2O-injected oocyte, closed diamonds). The inset shows the outward steady state current (mean ±se; formula image) recorded at +45 mV (I+45) under the same conditions for oocytes injected with H2O (left) and oocytes injected with AKT2 (right).
Figure 4.
Figure 4.
Patch–Clamp Recording of AKT2 Expressed in COS Cells or Xenopus Oocytes. (A) COS whole-cell recordings of AKT2 currents elicited in a 150 mM K+ external solution by 2.7-sec voltage pulses from –160 to +40 mV (20-mV steps, 0 mV holding potential, and 0 current level are indicated by dotted lines). (B) I/V plots from records obtained in a 150 mM K+ external solution. Steady state currents were sampled at the end of the 2.7-sec pulses (open circles), instantaneous currents were sampled at the beginning of the pulses (open squares), and time-dependent current were calculated as the difference between these two components (open triangles). All data are mean ±se from six COS cells. (C) AKT2 single-channel currents in a COS cell recorded under voltage–clamp at –75, –100, and –125 mV. C, closed state; O, open state. (D) AKT2 single-channel currents in a Xenopus oocyte recorded under voltage–clamp at +50, 0, –50, –100, and –150 mV. C, closed state; O, open state. (E) Trace at top, normalized sum of 300 pulses at –150 mV from a holding potential of 0 mV (Xenopus oocyte; see [D]). Trace at bottom, normalized current at –150 mV measured by two-electrode voltage–clamp (Xenopus oocyte; see Figure 3). (F) Single-channel current–voltage relationship measured during voltage–clamp experiments with Xenopus oocytes (100 mM K+ in the pipette, closed circles; mean ±se; formula image) and COS cells (150 mM K+ in the pipette, open circles; mean ±se; formula image). The inward single-channel conductance derived from the slope of the linear section of the I/V curves at negative membrane potential is 23.8 ± 0.5 (three to seven oocytes) and 29.8 ± 0.6 (three COS cells).
Figure 5.
Figure 5.
Effects of External or Internal pH on AKT2 Macroscopic Currents in Xenopus Oocytes. (A) External acidification. Relationship of the total AKT2 current to the membrane potential (in 100 mM external K+) at external pH 7.0 (open circles) or 5.6 (closed circles) (mean ±se; formula image). (B) Internal acidification. Relationship of the total AKT2 current to the membrane potential at internal pH 7.4 (100 mM KCl, pH 7.0, in the bath, open circles) or at internal pH 7.0 (100 mM potassium acetate, pH 7.0, in the bath, closed circles) (mean ±se; formula image). (C) Inhibition of the time-dependent and instantaneous components of the AKT2 current by external (pHe) or internal (pHi) acidification (experimental conditions as given in [A] and [B], respectively). Data (mean ±se; formula image) are expressed as the percentage of the control (open symbols in [A] and [B]) for a –150 mV membrane potential.
Figure 6.
Figure 6.
Inhibition of AKT2 Current in COS Cells by Cs+ and External Acidification. (A) Instantaneous AKT2 current plotted against membrane potential. The external solution contained 150 mM K+, pH 7.4 (open squares), or 150 mM K+ and 10 mM Cs+, pH 7.4 (closed squares). Data are mean ±se (formula image 5). (B) AKT2 current at steady state plotted against membrane potential. The control was 100 mM K+, pH 7.4, in the external solution (open circles). External acidification was with 100 mM K+, pH 6.5 (closed diamonds) or 5.6 (open diamonds), in the external solution. Data are mean ±se (formula image 5). (C) Comparison of the inhibition of AKT2 instantaneous current (hexagons) and the time-dependent current (inverted triangles) by external acidification from pH 7.4 to 6.5 (closed symbols) or from pH 7.4 to 5.6 (open symbols). Data are mean ±se (formula image).

Similar articles

Cited by

References

    1. Barhanin, J., Lesage, F., Guillemare, E., Fink, M., Lazdunski, M., and Romey, G. (1996). KvLQT1 and IsK (MinK) proteins associate to form the IKs cardiac potassium current. Nature 384, 78–83. - PubMed
    1. Blatt, M.R. (1992). K+channels of stomatal guard cells: Characteristics of the inward rectifier and its control by pH. J. Gen. Physiol. 99, 615–644. - PMC - PubMed
    1. Cao, Y., Ward, J.M., Kelly, W.B., Ichida, A.M., Gaber, R.F., Anderson, J.A., Uozumi, N., Schroeder, J.I., and Crawford, N.M. (1995). Multiple genes, tissue specificity, and expression-dependent modulation contribute to functional diversity of potassium channels in Arabidopsis thaliana. Plant Physiol. 109, 1093–1106. - PMC - PubMed
    1. Clough, S.J., and Bent, A.F. (1998). Floral dip: A simplified method for Agrobacterium-mediated transformation of Arabidopsis thaliana. Plant J. 16, 735–743. - PubMed
    1. Daram, P., Urbach, S., Gaymard, F., Sentenac, H., and Chérel, I. (1997). Tetramerization of the AKT1 plant potassium channel involves its C-terminal cytoplasmic domain. EMBO J. 16, 3455–3463. - PMC - PubMed

Publication types

MeSH terms