. 2000 Jun;12(6):949-61.
doi: 10.1105/tpc.12.6.949.

Developmental regulation of methyl benzoate biosynthesis and emission in snapdragon flowers

Affiliations

Developmental regulation of methyl benzoate biosynthesis and emission in snapdragon flowers

N Dudareva et al. Plant Cell. 2000 Jun.

Abstract

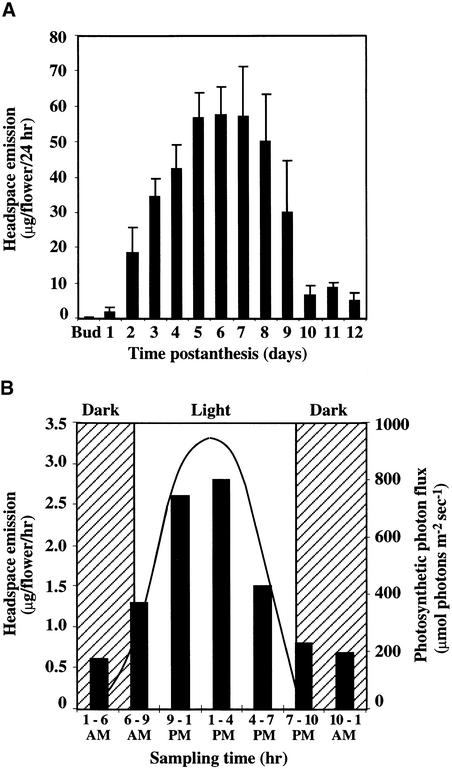
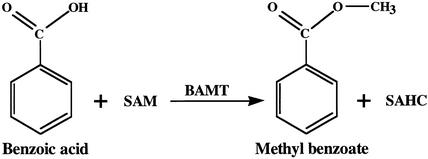
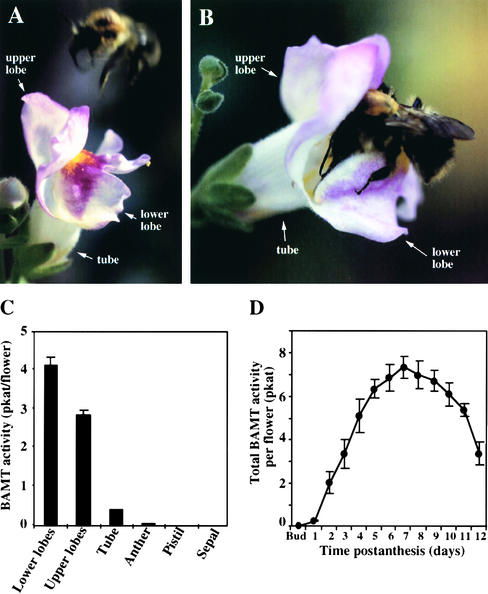
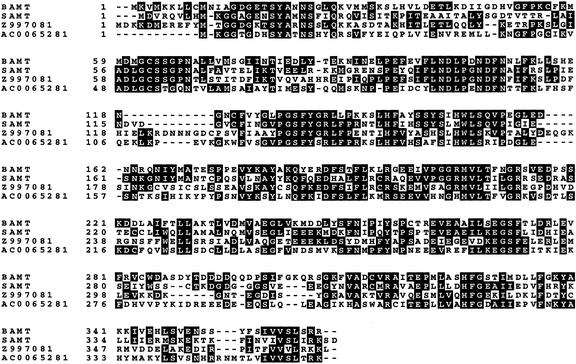
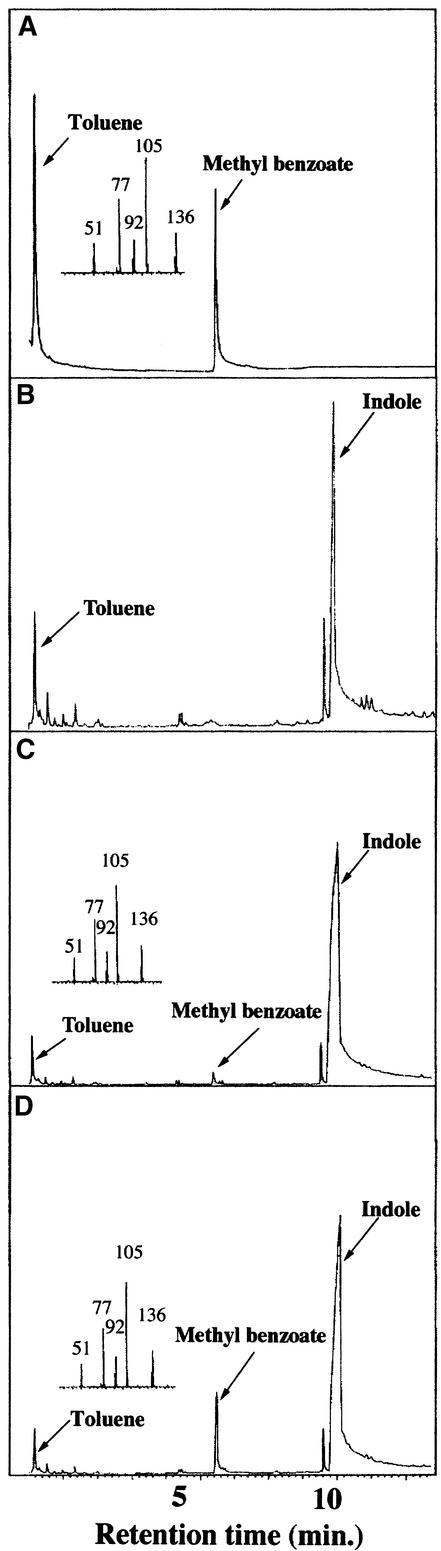
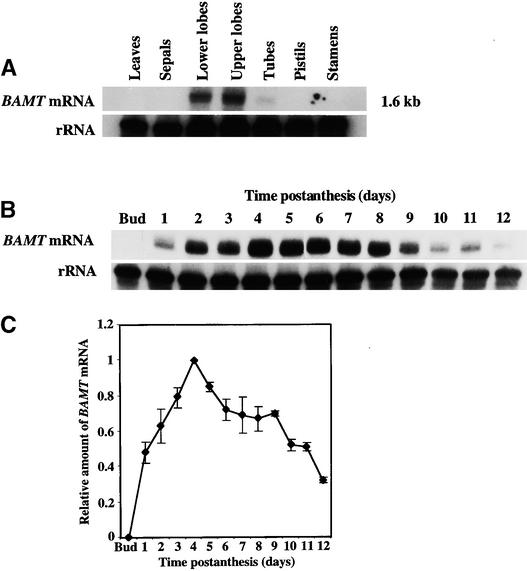
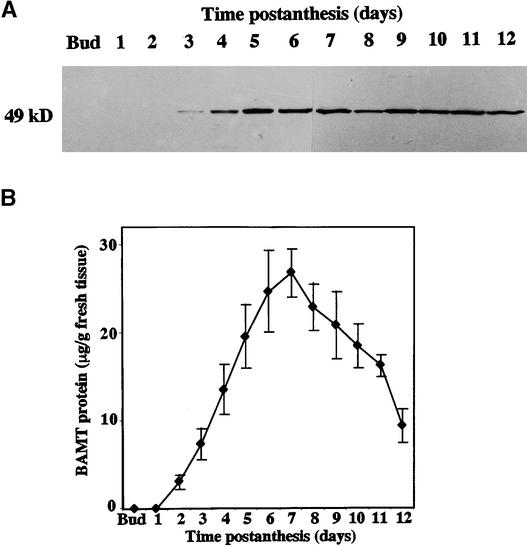
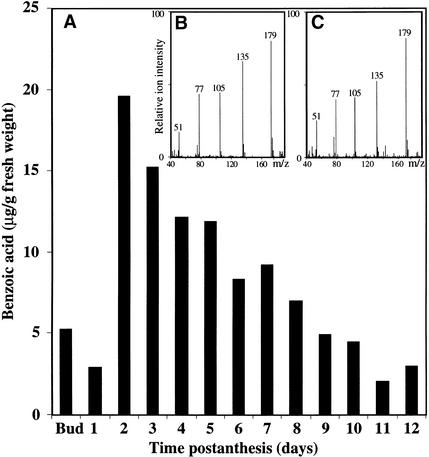
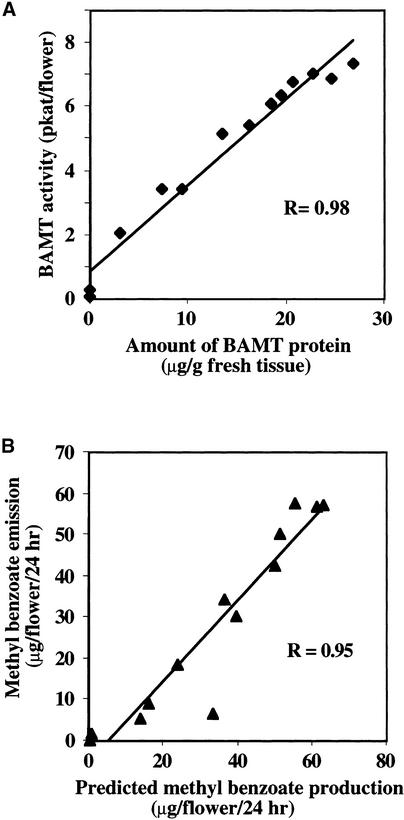
In snapdragon flowers, the volatile ester methyl benzoate is the most abundant scent compound. It is synthesized by and emitted from only the upper and lower lobes of petals, where pollinators (bumblebees) come in contact with the flower. Emission of methyl benzoate occurs in a rhythmic manner, with maximum emission during the day, which correlates with pollinator activity. A novel S-adenosyl-l-methionine:benzoic acid carboxyl methyl transferase (BAMT), the final enzyme in the biosynthesis of methyl benzoate, and its corresponding cDNA have been isolated and characterized. The complete amino acid sequence of the BAMT protein has only low levels of sequence similarity to other previously characterized proteins, including plant O-methyl transferases. During the life span of the flower, the levels of methyl benzoate emission, BAMT activity, BAMT gene expression, and the amounts of BAMT protein and benzoic acid are developmentally and differentially regulated. Linear regression analysis revealed that production of methyl benzoate is regulated by the amount of benzoic acid and the amount of BAMT protein, which in turn is regulated at the transcriptional level.


Figures

Figure 1.
Figure 1.
Emission of Methyl Benzoate from Snapdragon Flowers Measured by Headspace Collection and GC-MS Analysis. (A) Emission of methyl benzoate during the life span of the flower, from mature flower buds 1 day before opening to 12 days after anthesis. Data are means ±se (formula image). (B) Emission of methyl benzoate within a 24-hr period. Headspace collections were performed at 3-hr intervals during the light period and at 6-hr intervals at night. Black bars show emission; the curved line shows photosynthetic photon flux.
Figure 2.
Figure 2.
Reaction Catalyzed by BAMT. SAM is a donor of the methyl group; SAHC, S-adenosyl-l-homocysteine.
Figure 3.
Figure 3.
Amounts of BAMT Activity in Different Parts of a Snapdragon Flower and at Different Stages of Flower Development. (A) Antirrhinum flower with a visiting bumblebee. The bumblebee is in flight, approaching the flower. Only the upper and lower petal lobes are facing the bee during landing. (B) The bumblebee is entering the snapdragon flower in the classic way. The bee opens the mouth of the corolla tube, and only upper and lower lobes of the petals come in contact with the bee's body. In this way, a bee can be perfumed by floral scent produced only in the upper and lower petal lobes. Photographs (A) and (B) have been donated by Iris Heidmann from the Max-Planck-Institut für Züchtungsforschung, Cologne, Germany. (C) BAMT activity in different flower parts of a 6-day-old snapdragon flower. The values of 120, 130, and 200 mg were used for the total weight of the upper and lower lobes and the tube, respectively. Protein concentrations for the upper and lower lobes and the tube were 1.45, 1.83, and 0.72 mg mL−1, respectively, and can be used to calculate specific activities per milligram of protein. Values are the average of five independent measurements. Error bars indicate standard deviations. (D) Changes in BAMT activity during flower development. Data are shown only for upper and lower petal lobes that contained BAMT activity. For each time point, enzyme assays were run in duplicate on at least five independent crude extract preparations, and the standard deviations were obtained.
Figure 4.
Figure 4.
Comparison of the Predicted Amino Acid Sequence of Snapdragon BAMT Protein with Related Proteins. SAMT is SAM:salicylic acid carboxyl methyl transferase from C. breweri (GenBank accession number AF133053). Proteins with GenBank accession numbers Z997081 and AC0065281 correspond to two hypothetical proteins from Arabidopsis. Black boxes indicate conserved amino acid residues, and dashes indicate gaps that have been inserted for optimal alignment. Sequences were aligned and displayed using the ClustalW and Boxshade 3.21 software programs (Human Genome Sequencing Center, Houston, TX).
Figure 5.
Figure 5.
Detection of Methyl Benzoate in the Medium of E. coli Cells Expressing Snapdragon BAMT. (A) GC-MS analysis of methyl benzoate standard. (B) Analysis of the medium of E. coli cells expressing pET-T7 (11a) vector with no insert after induction with isopropyl-β-d-thiogalactopyranoside. (C) Analysis of the medium of E. coli cells expressing snapdragon BAMT after induction with isopropyl-β-d-thiogalactopyranoside. The growing medium was not supplemented with benzoic acid. The mass spectrum is that of the peak eluted at the same retention time as the authentic methyl benzoate standard (A). (D) Analysis of the medium of E. coli cells expressing snapdragon BAMT after induction with isopropyl-β-d-thiogalactopyranoside. The growth medium was supplemented with 5 μg mL−1 benzoic acid. The mass spectrum is that of the peak eluted at the same retention time as the authentic methyl benzoate standard (A). Toluene was added to all samples as an internal standard. Indole is produced by all E. coli cells (Dudareva et al., 1998a; Ross et al., 1999). Numbered peaks in (A), (C), and (D) represent mass-to-charge ratios of molecular ion and fragment ions of methyl benzoate.
Figure 6.
Figure 6.
RNA Gel Blot Analysis of BAMT Gene Expression. (A) Tissue specificity of BAMT gene expression. Total RNA was isolated from young leaves, sepals, pistil, stamens, upper and lower petal lobes, and tubes of a 6-day-old flower; 7 μg of total RNA was loaded in each lane. The top gel represents the results of hybridization with a BAMT probe. The length of the BAMT mRNA was estimated as 1.6 kb by comparison with RNA molecular markers in an adjacent lane. Autoradiography was for 24 hr. The blot was rehybridized with an 18S rDNA probe (bottom) to standardize sample results. (B) Developmental changes in steady state BAMT mRNA amounts in upper and lower lobes of snapdragon petals. Shown is RNA gel blot hybridization with mRNA from upper and lower petal lobes at different stages of development. The yield of total RNA from upper and lower petal lobes per gram of tissue (fresh weight) at different stages of development was very similar at all stages, varying from 120 to 190 μg. Each lane contained 3 μg of total RNA. Autoradiography was for 24 hr. The blots were rehybridized with an 18S rDNA probe (bottom) to standardize sample results. (C) Plot of the variations in BAMT mRNA content in upper and lower petal lobes throughout the life span of the flower. Values were obtained by scanning RNA gel blots with a PhosphorImager. Each point is the average of five different experiments (including the one shown in [B]), and values were corrected by standardizing for the amounts of 18S rRNA measured in the same runs. Error bars indicate standard deviations.
Figure 7.
Figure 7.
Developmental Changes in BAMT Protein Concentrations in Upper and Lower Lobes of Snapdragon Petals. (A) Expression of the BAMT protein in upper and lower petal lobes at different stages of development. Representative protein gel blot shows the 49-kD protein recognized by anti–BAMT antibodies. Proteins were extracted from upper and lower petal lobes at different stages of development, and 20 μg of protein was loaded in each lane. (B) Plot of variations in the amounts of BAMT protein in upper and lower petal lobes throughout the life span of the flower. Values were obtained by scanning the protein gel blots. Each point is the average of seven different experiments (including the one shown in [A]). Standard error values are indicated as vertical bars.
Figure 8.
Figure 8.
Developmental Changes in the Amount of Benzoic Acid in Upper and Lower Lobes of Snapdragon Petals. (A) Benzoic acid, extracted from upper and lower petal lobes at different stages of development by supercritical carbon dioxide extraction, was analyzed by HPLC. (B) Electron impact mass spectrum of derivatized authentic benzoic acid. Molecular weight of derivatized benzoic acid is 194; after ionization, the highest mass-to-charge ratio (m/z) is the loss of a CH3 radical, resulting in an m/z of 179. (C) Electron impact mass spectrum of derivatized benzoic acid isolated from 2-day-old snapdragon petals. A peak corresponding to benzoic acid was collected after HPLC, derivatized, and analyzed by GC-MS. In (B) and (C), the numbered peaks are the m/z values for the fragment ions of the derivatized benzoic acid.
Figure 9.
Figure 9.
Regulation of Methyl Benzoate Emission in Snapdragon Flowers. (A) Comparison between BAMT activity and amount of BAMT protein during the life span of the snapdragon flower. BAMT activity data are shown in Figure 3D; the amount of BAMT protein is shown in Figure 7B. (B) Comparison between emitted amount and predicted production of methyl benzoate during the life span of the snapdragon flower. The emitted amount of methyl benzoate is shown in Figure 1A. The predicted production of methyl benzoate was calculated from Equations 1 and 2 given in Methods.

References

    1. Bradford, M.M. (1976). A rapid and sensitive method for the quantitation of microgram quantities of protein utilizing the principle of protein–dye binding. Anal. Biochem. 72, 248–254. - PubMed
    1. Coen, E.S., and Meyerowitz, E.M. (1991). The war of the whorls: Genetic interactions controlling flower development. Nature 353, 31–37. - PubMed
    1. Coen, E.S., Carpenter, R., and Martin, C. (1986). Transposable elements generate novel spatial patterns of gene expression in Antirrhinum majus. Cell 47, 285–296. - PubMed
    1. Dobson, H.E.M. (1994). Floral volatiles in insect biology. In Insect–Plant Interactions, Vol. 5, E. Bernays, ed (Boca Raton, FL: CRC Press), pp. 47–81.
    1. Dudareva, N., and Pichersky, E. (2000). Biochemical and molecular aspects of floral scents. Plant Physiol. 122, 627–634. - PMC - PubMed

Publication types

MeSH terms