Comparative Study
. 2000 Jun 20;97(13):7645-50.
doi: 10.1073/pnas.120162397.

Gamma and beta frequency oscillations in response to novel auditory stimuli: A comparison of human electroencephalogram (EEG) data with in vitro models

Affiliations
Comparative Study

Gamma and beta frequency oscillations in response to novel auditory stimuli: A comparison of human electroencephalogram (EEG) data with in vitro models

C Haenschel et al. Proc Natl Acad Sci U S A. .

Abstract

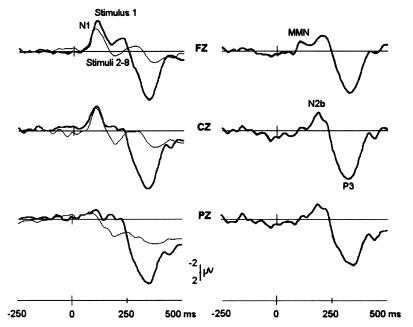
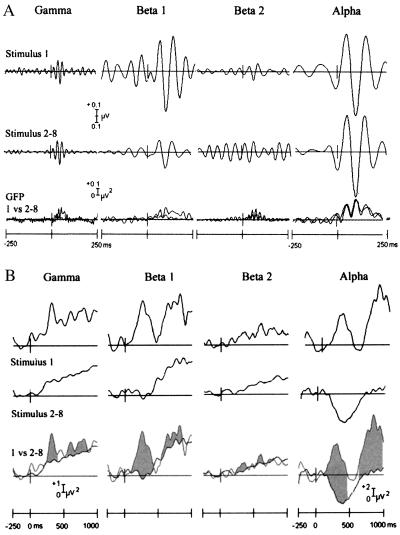
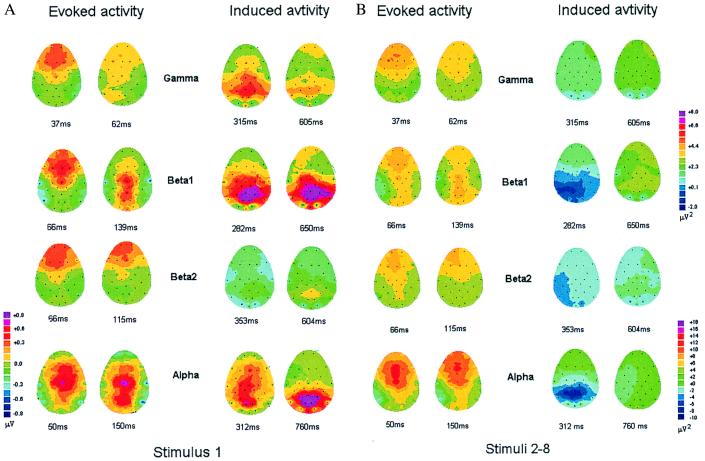
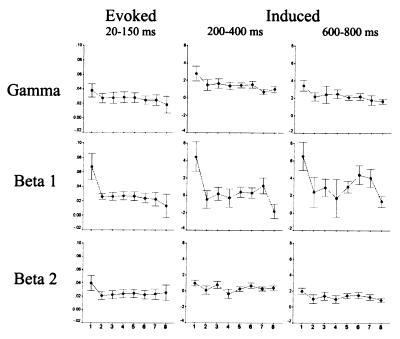
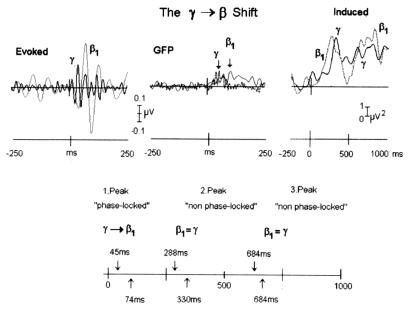
Investigations using hippocampal slices maintained in vitro have demonstrated that bursts of oscillatory field potentials in the gamma frequency range (30-80 Hz) are followed by a slower oscillation in the beta 1 range (12-20 Hz). In this study, we demonstrate that a comparable gamma-to-beta transition is seen in the human electroencephalogram (EEG) in response to novel auditory stimuli. Correlations between gamma and beta 1 activity revealed a high degree of interdependence of synchronized oscillations in these bands in the human EEG. Evoked (stimulus-locked) gamma oscillations preceded beta 1 oscillations in response to novel stimuli, suggesting that this may be analogous to the gamma-to-beta shift observed in vitro. Beta 1 oscillations were the earliest discriminatory responses to show enhancement to novel stimuli, preceding changes in the broad-band event-related potential (mismatch negativity). Later peaks of induced beta activity over the parietal cortex were always accompanied by an underlying gamma frequency oscillation as seen in vitro. A further analogy between in vitro and human recordings was that both gamma and beta oscillations habituated markedly after the initial novel stimulus presentation.


Figures

Figure 1
Figure 1
Broad-band ERPs shown in response to the first stimulus and stimuli 2–8 (Left) and corresponding difference waves (Right) for fronto-central (FZ, Top), vertex (CZ, Middle), and centro-parietal (PZ, Bottom) electrodes. MMN, mismatch negativity. Note the prominent P3 potential at 320 ms with a vertex maximum compared with the more posterior peak at 350 ms. The former resembles the “novelty P3” (P3a) described by Knight and Nakada (30).
Figure 2
Figure 2
(A) Stimulus-locked oscillations. Grand average auditory evoked responses to stimulus 1 and stimuli 2–8 are shown for gamma (30–50 Hz), beta 1 (12–20 Hz), beta 2 (20–30 Hz), and alpha bands (8–12 Hz). Global Field Power (GFP) quantifies the spatial potential field over the scalp. Note that the GFP values exhibit twice the frequency of the bandpass frequency because of rectification of the data when computing root-mean-square values. (B) Induced activity. Time windows used for statistical analysis of the two induced peaks are indicated in shading in the bottom traces.
Figure 3
Figure 3
Topographical maps of the evoked and induced activity for the first stimulus (A) and the mean of stimuli 2–8 (B) are shown for all four frequency bands. For evoked activity, maps were computed for the two positive peaks around the GFP maximum. For induced activity, maps are shown for the maxima of the early and late induced peaks. Note that the maps of evoked beta 1 exhibit an early fronto-central and a later centro-parietal distribution. Polarity information is not included in the distribution of induced peaks.
Figure 4
Figure 4
Mean and standard error are shown for the evoked and induced activity in response to the first eight stimuli in each trial. Response amplitude in the evoked and induced beta 1 band differed significantly between the first, novel, stimulus and the mean of all subsequent stimuli.
Figure 5
Figure 5
(Upper) The temporal sequence of the early (evoked) and late (induced) oscillatory activity in the gamma and beta 1 band is illustrated. Note that the shift from gamma to beta 1 occurred at the initial phase-locked response, whereas the induced peaks were not significantly different in latency. The time scale and voltage scaling for evoked and induced oscillations differ. (Lower) Schematic summary of the temporal sequence using a common time-scale, showing that the gamma-to-beta transition as seen in vitro was observed only for the early evoked (phase-locked) peak. There were no significant differences between the late induced gamma and beta 1 bands in peak latency.

Similar articles

Cited by

References

    1. Barth D S, MacDonald K D. Nature (London) 1996;383:78–81. - PubMed
    1. Roelfsema P R, Engel A K, Konig P, Singer W. Nature (London) 1997;385:157–161. - PubMed
    1. Rodriguez E, George N, Lachaux J P, Martinerie J, Renault B, Varela F J. Nature (London) 1999;397:430–433. - PubMed
    1. Miltner W H, Braun C, Arnold M, Witte H, Taub E. Nature (London) 1999;397:434–436. - PubMed
    1. Gray C M, McCormick D A. Science. 1996;274:109–113. - PubMed

Publication types

LinkOut - more resources