Comparative Study
. 2000 Jun;10(6):776-88.
doi: 10.1101/gr.10.6.776.

An EST-enriched comparative map of Brassica oleracea and Arabidopsis thaliana

Affiliations
Comparative Study

An EST-enriched comparative map of Brassica oleracea and Arabidopsis thaliana

T H Lan et al. Genome Res. 2000 Jun.

Abstract

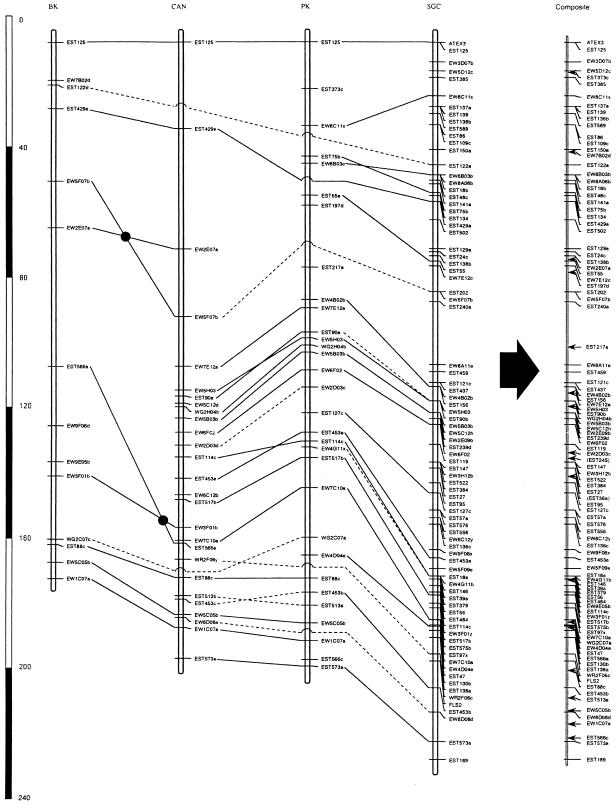
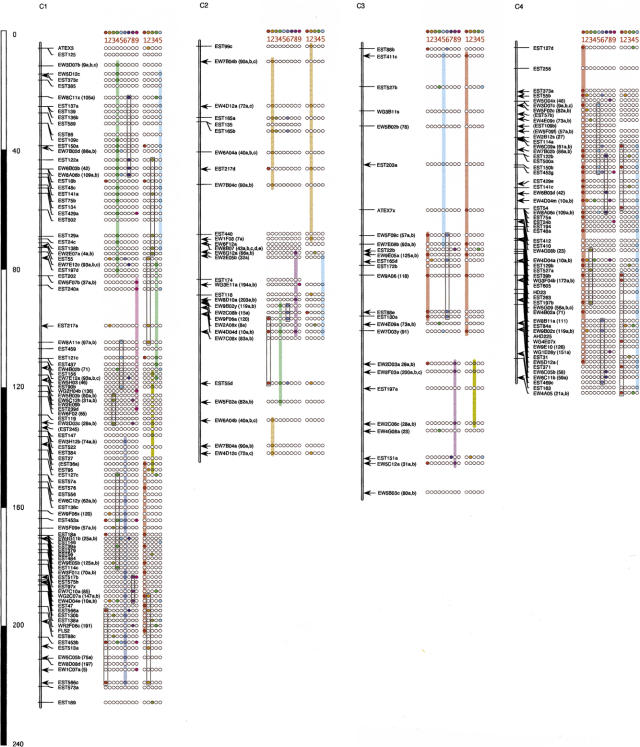
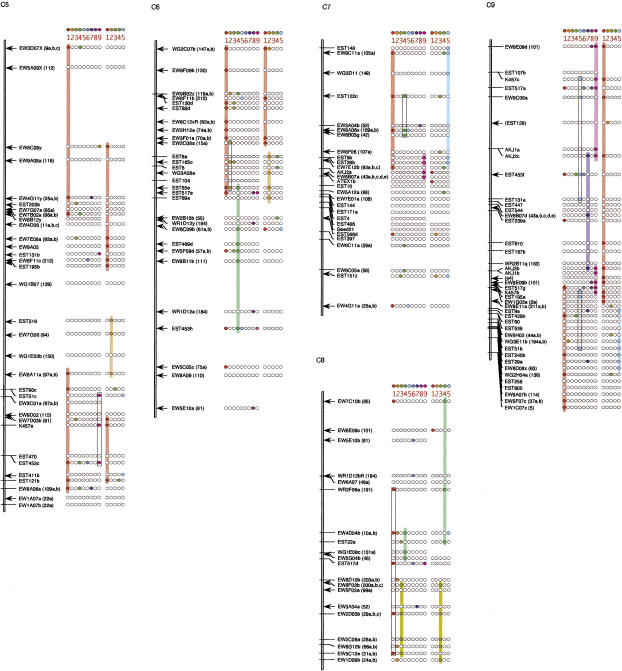
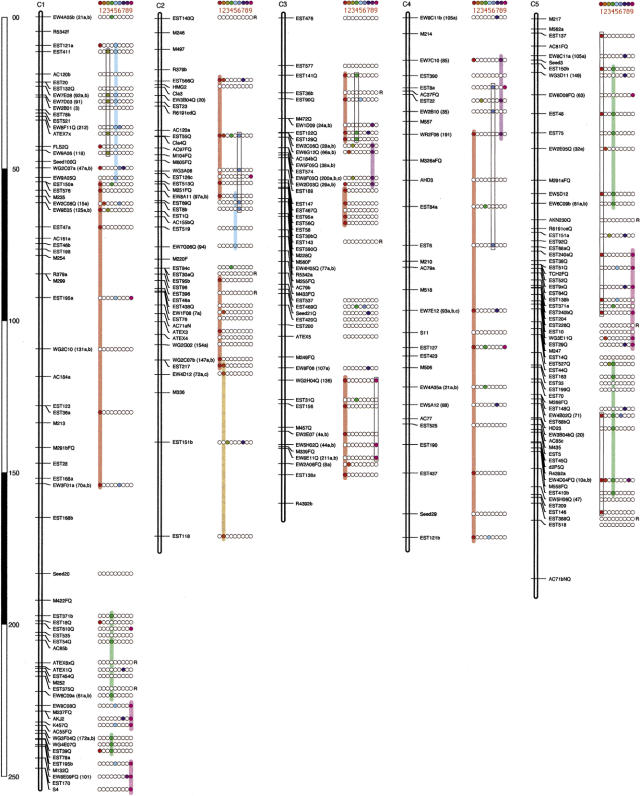
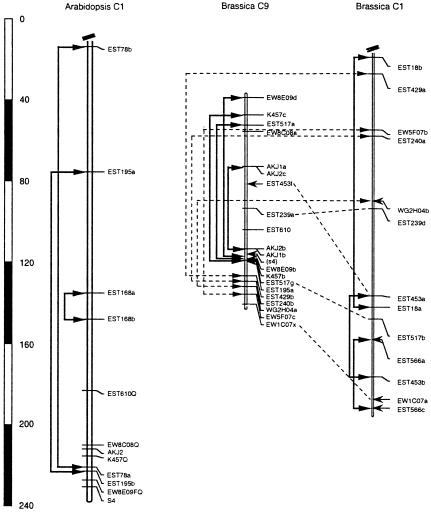
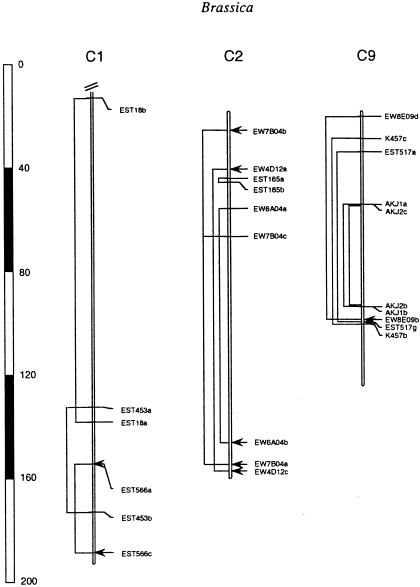
A detailed comparative map of Brassica oleracea and Arabidopsis thaliana has been established based largely on mapping of Arabidopsis ESTs in two Arabidopsis and four Brassica populations. Based on conservative criteria for inferring synteny, "one to one correspondence" between Brassica and Arabidopsis chromosomes accounted for 57% of comparative loci. Based on 186 corresponding loci detected in B. oleracea and A. thaliana, at least 19 chromosome structural rearrangements differentiate B. oleracea and A. thaliana orthologs. Chromosomal duplication in the B. oleracea genome was strongly suggested by parallel arrangements of duplicated loci on different chromosomes, which accounted for 41% of loci mapped in Brassica. Based on 367 loci mapped, at least 22 chromosomal rearrangements differentiate B. oleracea homologs from one another. Triplication of some Brassica chromatin and duplication of some Arabidopsis chromatin were suggested by data that could not be accounted for by the one-to-one and duplication models, respectively. Twenty-seven probes detected three or more loci in Brassica, which represent 25.3% of the 367 loci mapped in Brassica. Thirty-one probes detected two or more loci in Arabidopsis, which represent 23.7% of the 262 loci mapped in Arabidopsis. Application of an EST-based, cross-species genomic framework to isolation of alleles conferring phenotypes unique to Brassica, as well as the challenges and opportunities in extrapolating genetic information from Arabidopsis to Brassica and to more distantly related crops, are discussed.


Figures

Figure 1
Figure 1
The assembly of the Brassica chromosome 1 composite map. Common loci (based on common restriction fragment sizes) were connected by solid lines, putatively homologous loci (with different restriction fragment sizes, but at corresponding sites) are connected by dashed lines. Filled circles placed on crossed lines indicate that respective orders of loci are statistically significantly different (≥LOD 2.0) in the respective maps, suggesting possible chromosomal rearrangements. Arrows indicate the inferred locations of unique loci in the consensus map.
Figure 2
Figure 2
Composite RFLP linkage map of Brassica olearacea RCB x GC, RCB x CAN, RCB x PK and RCB x BK F2 Populations. Filled circles next to the loci indicate homoeologous Brassica loci (chromosomes 1-9, near right) or homologous Arabidopsis loci (chromosomes 1-5, far right) detected by the same probe. Open circles indicate that no polymorphism was detected for homoeologous (Brassica) and homologous (Arabidopsis) loci. A letter “R” next to the probe name indicates that the probe hybridizes to a repetitive DNA sequence in Arabidopsis. Specific colors are assigned to each homoeologous and homologous chromosome. Markers included in the duplication (Brassica) or one-to-one (Arabidopsis) models are connected by colored columns. Open columns indicate possible triplicated (Brassica) or duplicated (Arabidopsis) regions.
Figure 2
Figure 2
Composite RFLP linkage map of Brassica olearacea RCB x GC, RCB x CAN, RCB x PK and RCB x BK F2 Populations. Filled circles next to the loci indicate homoeologous Brassica loci (chromosomes 1-9, near right) or homologous Arabidopsis loci (chromosomes 1-5, far right) detected by the same probe. Open circles indicate that no polymorphism was detected for homoeologous (Brassica) and homologous (Arabidopsis) loci. A letter “R” next to the probe name indicates that the probe hybridizes to a repetitive DNA sequence in Arabidopsis. Specific colors are assigned to each homoeologous and homologous chromosome. Markers included in the duplication (Brassica) or one-to-one (Arabidopsis) models are connected by colored columns. Open columns indicate possible triplicated (Brassica) or duplicated (Arabidopsis) regions.
Figure 3
Figure 3
Composite RFLP linkage map of Arabidopsis thaliana HM x WS and M13 x WS F2 populations. Markers designated “FQ” are anchor loci, common to both populations. Markers mapped in the HM x WS population are designated “Q”. The remaining markers were mapped in M13 x WS only. The construction of the A. thaliana composite map was as reported previously (Kowalski et al. 1994a). It should be noted that integration of data from two populations tends to inflate recombinational distance due to unequal recombination between populations. The filled circles next to the loci indicate homoeologous loci detected by the same probe on the Brassica composite map. Open circles indicate that no polymorphism was detected for homoeologous loci in RCB x GC Brassica populations. The letter “R” next to a probe name indicates that it hybridizes to a repetitive DNA sequence in the Brassica genome. Specific colors are asigned to each homoeologous chromosome. Markers included in the one-to-one model for Arabidopsis-Brassica correspondence are connected by filled columns. Open columns indicate possible duplicated regions in Brassica.
Figure 4
Figure 4
Intrachromosomal duplication of Arabidopsis chromosome 1, and an possible more-than-triplicated region of Brassica chromosome 1 and 9. Solid lines connect homoeologous loci (based on different restriction fragment sizes) located on the same chromosome. Dashed lines connect homoeologous loci located on different chromosomes.
Figure 5
Figure 5
Intrachromosomal duplication detected by three or more duplicate loci in Brassica.

Similar articles

Cited by

References

    1. Agyare FD, Lashkari DA, Lagos A, Namath AF, Lagos G, et al. Mapping expressed sequence tag sites on yeast artificial chromosome clones of Arabidopsis thaliana DNA. Genome Res. 1997;7:1–9. - PubMed
    1. Ahn S, Tanksley SD. Comparative linkage maps of the rice and maize genomes. Proc Natl Acad Sci. 1993;90:7980–7984. - PMC - PubMed
    1. Arumuganathan K, Earle ED. Estimation of nuclear DNA content of plants by flow cytometry. Plant Mol Biol Rep. 1991;9:208–218.
    1. Berry R, Stevens TJ, Walter NAR, Wilcox AS, Rubano T, et al. Gene-based sequence-tagged-sites (STSs) as the basis for a human gene map. Nat Genet. 1995;10:415–423. - PubMed
    1. Botella MA, Coleman MJ, Hughes DE, Nishimura MT, Jones JDG, et al. Map positions of 47 Arabidopsis sequences with sequence similarity to disease resistance genes. Plant J. 1997;12:1197–1211. - PubMed

Publication types