Comparative Study
. 2000 Jun;10(6):808-18.
doi: 10.1101/gr.10.6.808.

Whole-genome trees based on the occurrence of folds and orthologs: implications for comparing genomes on different levels

Affiliations
Comparative Study

Whole-genome trees based on the occurrence of folds and orthologs: implications for comparing genomes on different levels

J Lin et al. Genome Res. 2000 Jun.

Abstract

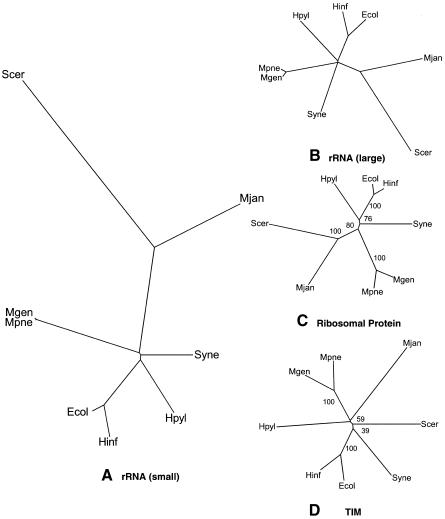
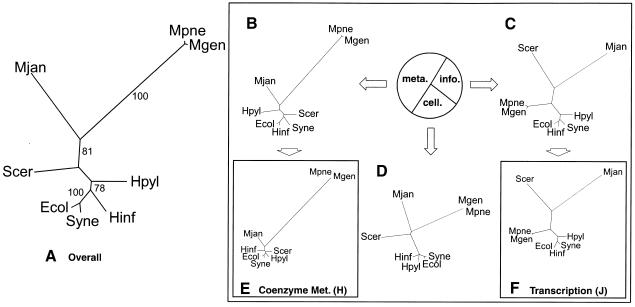
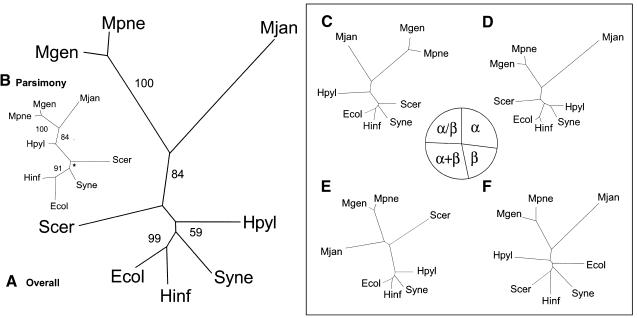
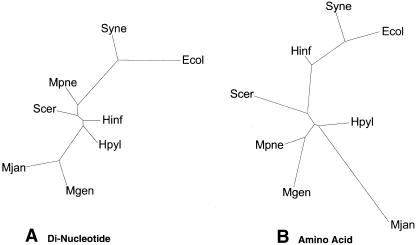
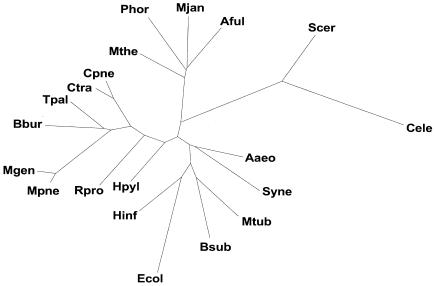
We built whole-genome trees based on the presence or absence of particular molecular features, either orthologs or folds, in the genomes of a number of recently sequenced microorganisms. To put these genomic trees into perspective, we compared them to the traditional ribosomal phylogeny and also to trees based on the sequence similarity of individual orthologous proteins. We found that our genomic trees based on the overall occurrence of orthologs did not agree well with the traditional tree. This discrepancy, however, vanished when one restricted the tree to proteins involved in transcription and translation, not including problematic proteins involved in metabolism. Protein folds unite superficially unrelated sequence families and represent a most fundamental molecular unit described by genomes. We found that our genomic occurrence tree based on folds agreed fairly well with the traditional ribosomal phylogeny. Surprisingly, despite this overall agreement, certain classes of folds, particularly all-beta ones, had a somewhat different phylogenetic distribution. We also compared our occurrence trees to whole-genome clusters based on the composition of amino acids and di-nucleotides. Finally, we analyzed some technical aspects of genomic trees-e.g., comparing parsimony versus distance-based approaches and examining the effects of increasing numbers of organisms. Additional information (e.g. clickable trees) is available from http://bioinfo.mbb.yale.edu/genome/trees.


Figures

Figure 1
Figure 1
Representative single-gene trees. (A) The traditional small subunit ribosomal phylogenetic tree. This is a tree of eight completely sequenced representative organisms constructed with the SSU rRNA. Trees could be constructed using data from two different sources: the Ribosomal Database Project (RDP, http://www.cme.msu.edu/RDP, Maidak et al. 1999) and the rRNA WWW Server (http://www-rrna.uia.ac.be, Van de Peer et al. 1999). Although a tree can be abstracted from the RDP, the tree cannot contain both prokaryotes and eukaryotes. Instead, we took sequences from the RDP and the rRNA WWW server and aligned them with Clustal (Thompson et al. 1997). Phylip and PAUP were used to construct trees from the aligned sequences using distance and parsimony methods. There was little variation in the resulting trees displayed using TreeView (Page 1996), which was used to show all the trees used in this survey. The PAUP distance-based tree is shown. (B) The large subunit ribosomal tree. Another common method of building phylogenetic trees is the use of the large subunit rRNA (De Rijk et al. 1999). Because of the lack of large subunit rRNA information from the RDP, the sequences were downloaded from the rRNA WWW Server. The same method of tree construction was used as in A. The tree shown in B is the PAUP distance-based tree. Because of the large divergence of the species, the topology of the tree varied slightly when compared to the SSU ribosomal tree in A. The placement of Synechocystis was slightly different, as it is placed closer to the eukaryote and Archeae in the large subunit tree. This was relatively less significant when considering the branch lengths of the tree in A . (C , D) Representative trees based on sequence similarity of orthologs. The sequences of proteins for the different organisms were obtained from the COGs web site (http://www.ncbi.nlm.nih.gov/COG, Tatusov et al. 1999). Clusters of orthologous groups were chosen that had one protein for each organism in the group. There were eight such COGs with representatives from four different classes. Distance-based trees and parsimony trees were both constructed for each of the orthologous groups. There was great variation in the resulting trees. The tree, which had the highest similarity to the traditional ribosomal tree, is shown in C. In fact, the distance-based tree based on the 30S ribosomal protein S3 (COG92, Class J) in C is exactly the same in topology to the traditional tree. This is not surprising because we expect a ribosomal protein tree to be similar to ribosomal rRNA trees because of their interaction and conservation. For the bootstrap values, all bootstrap replicates grouped E. coli with H. influenzaee, S. cerevisiae with M. jannaschii, and M. genitalium with M. pneumoniae. In all, the conserved topology coupled with high bootstrap values shows that phylogenetic trees with even a single protein can exhibit very high fidelity to the traditional ribosomal tree. Besides trees with high similarity to the traditional tree as in C, there were trees that varied significantly from the traditional ribosomal tree. Part D shows a distance-based tree based on the metabolic enzyme triosephosphate isomerase (TIM). In general, there are a lot of differences between this tree and the traditional tree. M. jannaschii is grouped with M. genitalium and M. pneumoniae; M. jannaschii is not grouped with S. cerevisiae at all. The connectivity of S. cerevisiae and H. pylori is also different from the traditional tree. The low bootstrap values of 59% and 40% suggest that within the sequence there is great variation and the tree is generated with lower certainty. In general, there were a wide variety of trees produced using sequence similarity of orthologous proteins.
Figure 2
Figure 2
Genomic trees based on the occurrence of orthologs. (A) Distance-based genomic tree based on the overall occurrence of orthologous proteins in the complete genome. One of the alternative methods we used for phylogenetic analysis involved building trees based on the presence or absence of orthologs in the complete genome, using the information from the original COGs web site with eight genomes (http://www.ncbi.nlm.nih.gov/COG, Tatusov et al. 1999). For each of the microbial organisms, the occurrence of proteins in each of the clusters of orthologous groups was tabulated with 1 for present and 0 for absent. With the parsed data, a distance matrix was then calculated using the normalized Hamming distance, as described in the text. The trees were subsequently constructed using the kitsch program in the PHYLIP package, which allowed for easy automation. For the bootstrap values, we used PAUP. The resulting tree shown is a distance-based tree using the information of the occurrence of all the COGs in the genomes. As expected, the M. pneumoniae and M. genitalium are grouped with bootstrap values of 100%. However, interestingly, E. coli and Synechocystis are also clustered with this bootstrap value—a grouping that is not in the traditional tree. Also, M. jannaschii is clustered with M. pneumoniae and M. genitalium with a bootstrap value of 81%. Furthermore, the eukaryote, S. cerevisiae, is placed among the bacteria. (B, C, and D) Ortholog occurrence genomic trees based on a three-way partition of the whole ortholog set. As described in the text, the total COGs were divided into three large subsets, the information, cellular, and metabolic subsets. The pie chart in Figure 3 shows the number of COGs in each group as percentages. The metabolic subset dominated the total group with 362 COGs, approximately half of all the COGs. The information subset has 190 COGs, just above one quarter, while the cellular subset has 132 COGs, just less than a quarter. For each of the subsets, distance-based trees were generated using the same methods described in A. Because of the smaller sizes of these subsets, the bootstrap values were often ill-defined. The largest subset was the metabolic partition shown in B. There was a high correlation between the trees in A and B. Aside from the different placement of H. pylori and S. cerevisiae, the trees are nearly identical, even having similar branch lengths. The second largest partition was the information subset shown in C. Surprisingly, this subset produced a tree almost identical to the traditional ribosomal tree. The only difference is the switch in the placement of H. pylori and Synechocystis. This shows that although using the entire group of COGs may produce trees much different from the traditional tree, using a smaller subset may in fact produce a tree that is closer to the traditional topology. Part D shows the smallest partition, the cellular subset. (E and F) Representative genomic trees of ortholog occurrence based on specific functional classes J and H. Using the functional classes obtained from the COGs web site, the metabolic, information, and cellular partitions were subdivided further, into specific functional classes. For each of the different functional classes, there was a range of trees produced. Two representatives were chosen to show this variety. Class J (translation, ribosomal structure, and biogenesis), which has 108 clusters of orthologous proteins, is a further subdivision of the information subset. It has a tree very similar to the traditional ribosomal tree in Figure 1A. Class H (Coenzyme metabolism), which has 77 clusters of orthologous proteins, is a further subdivision of the metabolism subset. It produced a tree that did not correspond well to the traditional phylogeny.
Figure 3
Figure 3
Genomic trees based on the occurrence of folds. (A) Genomic tree based on the overall occurrence of folds in the genomes, generated by a distance-based method. For each of the microbial organisms the presence or absence of folds was marked with 1 or 0, respectively. The folds that were not present in any of the genomes were excluded, because this does not provide any distinguishing information. Similar to the ortholog occurrence, a distance matrix was generated with the Hamming distance. (B) Genomic tree based on the overall occurrence of folds in the genomes, generated by parsimony. Instead of generating a distance matrix, parsimony can be used for tree construction. For this task, PAUP was used and the resulting tree is mostly similar to the distance-based tree. However, the locations of S. cerevisiae and H. pylori are switched. Also, in contrast to the traditional ribosomal tree, S. cerevisiae is placed closer to M. jannaschii, whereas H. pylori is placed with the other bacteria. Therefore, the distance-based method as described in A seems to be better. For all the trees presented here, both distance-based and parsimony trees were generated; in general, as observed in this instance, the distance-based tree is closer to the ribosomal tree. The star shown in the bootstrap value represents a node where the bootstrap consensus tree results in a star decomposition and cannot be resolved. (C, D, E, and F) Distance-based genomic trees based on occurrence of folds in particular fold classes. In this analysis, instead of dividing the COGs into functional classes, the folds are fractionated into classes: all-alpha, all-beta, alpha+beta, and alpha/beta. As seen in the pie chart, the distribution of folds among the different classes is rather equal; each has approximately one quarter of the total. Of the four divisions of folds, the alpha+beta group is most similar to the overall tree, having the exact same topology. It also has the largest number of folds (81, 29% of the total). The all-alpha fold group has 27% (75) of the total folds and has almost the exact topology of the overall tree, except that H. pylori and Synechocystis are grouped together instead of just being close to each other. The alpha/beta group has 24% (68) of the total folds and is also very similar to the overall fold tree. The most surprising tree is that of the all-beta group. This is based on the smallest number of folds, which is 20% (55) of the total folds.
Figure 4
Figure 4
Trees based on overall composition. (A) Dinucleotide composition tree. We counted the relative frequency of the dinucleotides for the complete genomes of the eight organisms. Distance between two species of dinucleotides is the distance between the 16-dimensional vectors, with each axis representing a dinucleotide pair. PAUP then generated trees using the distance matrix. Figure 4A shows the resulting dinucleotide composition tree, which has almost no resemblance to the traditional ribosomal tree in Figure 1A. Even the M. genitalium and M. pneumoniae clustering, which is conserved throughout the survey, does not appear. This suggests that the dinucleotide method is not very accurate in the production of phylogenetic trees. Although it encompasses entire genomes, it reduces them to a 16-dimensional vector, losing much information. (B) Amino acid composition tree. This shows the tree generated from amino acid composition. Again, the relative frequencies of the amino acids were counted and a similar distance measure as in A was used. The distances between the genomes are calculated using 20-dimensional vectors, one for each amino acid. The resulting distance matrices were used to generate trees using PAUP. Interestingly, although this tree is still significantly different from the traditional tree in Figure 1A, it indeed is a great improvement upon the dinucleotide composition tree. Relatively, the organisms are closer in position to the traditional tree.
Figure 5
Figure 5
Prospects for the future. The figure shows a 20-genome tree based on the occurrence of folds. This is similar to Figure 3A. The unit in the SCOP classification that was used was the structural superfamily rather than the fold. For eight genome occurrence trees there is no difference between one made at the fold or superfamily level. However, for the 20-genome tree this distinction matters. The additional species names in the 20-genome tree are: Aaeo (Aquifex aeolicus), Aful (Archaeoglobus fulgidus), Bsub (Bacillus subtilis), Bbur (Borrelia burgdorferi), Cpne (Chlamydia pneumoniae), Ctra (Chlamydia trachomatis), Ecol (Escherichia coli), Hinf (Haemophilus influenzae), Hpyl (Helicobacter pylori), Mthe (Methanobacterium thermoautotrophicum), Mjan (Methanococcus jannaschii), Mtub (Mycobacterium tuberculosis), Mgen (Mycoplasma genitalium), Mpne (Mycoplasma pneumoniae), Phor (Pyrococcus horikoshii), Rpro (Rickettsia prowazekii), Scer (Saccharomyces cerevisiae), Syne (Synechocystis sp.), and Tpal (Treponema pallidum).

References

    1. Altschul SF, Madden TL, Schaffer AA, Zhang J, Zhang Z, Miller W, Lipman DJ. Gapped BLAST and PSI-BLAST: A new generation of protein database search programs. Nucleic Acids Res. 1997;25:3389–3402. - PMC - PubMed
    1. Andersson SG, Zomorodipour A, Andersson JO, Sicheritz-Ponten T, Alsmark UC, Podowski RM, Naslund AK, Eriksson AS, Winkler HH, Kurland CG. The genome sequence of Rickettsia prowazekii and the origin of mitochondria. Nature. 1998;396:133–140. - PubMed
    1. Baldauf SL, Palmer JD, Doolittle WF. The root of the universal tree and the origin of eukaryotes based on elongation factor phylogeny. Proc Natl Acad Sci USA. 1996;93:7749–7754. - PMC - PubMed
    1. Blattner FR, Plunkett G, III, Bloch CA, Perna NT, Burland V, Riley M, Collado-Vides J, Glasner JD, Rode CK, Mayhew GF, et al. The complete genome sequence of Escherichia coli K-12. Science. 1997;277:1453–1462. - PubMed
    1. Brown JR, Doolittle WF. Root of the universal tree of life based on ancient aminoacyl-tRNA synthetase gene duplications. Proc Natl Acad Sci USA. 1995;92:2441–2445. - PMC - PubMed

Publication types

LinkOut - more resources