. 2000 Jun;10(6):839-52.
doi: 10.1101/gr.10.6.839.

The mosaic structure of human pericentromeric DNA: a strategy for characterizing complex regions of the human genome

Affiliations

The mosaic structure of human pericentromeric DNA: a strategy for characterizing complex regions of the human genome

J E Horvath et al. Genome Res. 2000 Jun.

Abstract

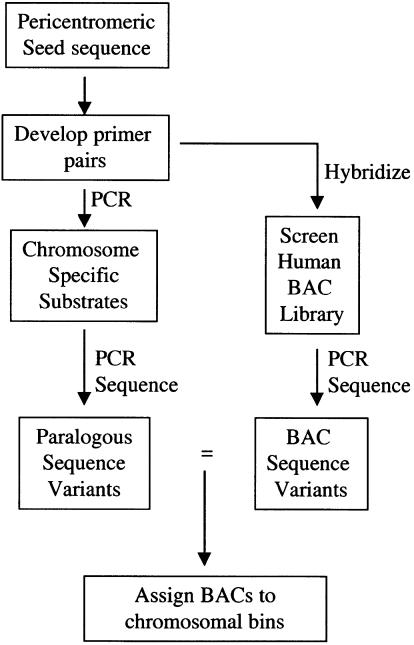
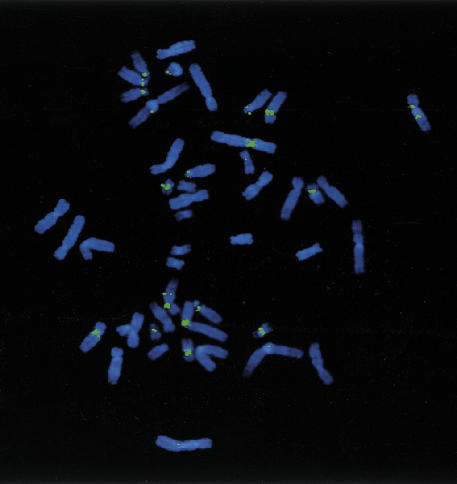
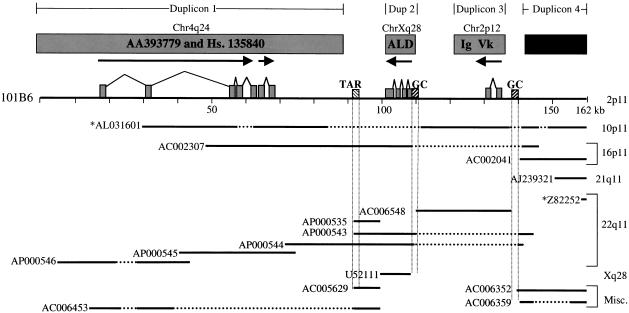
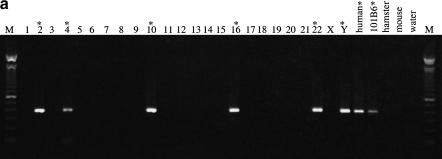
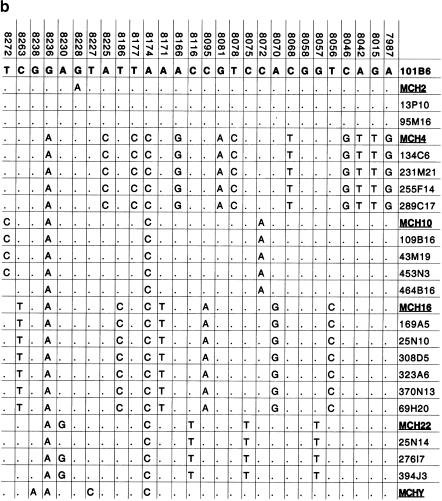
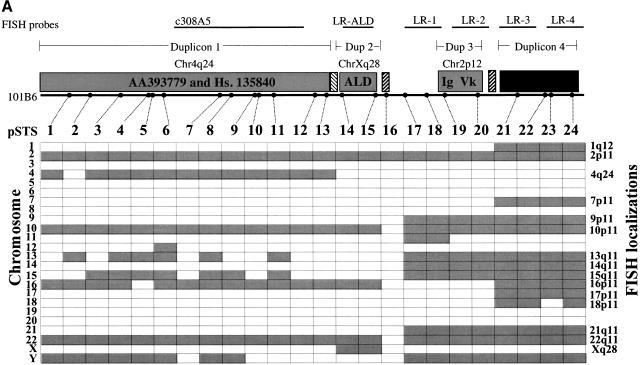
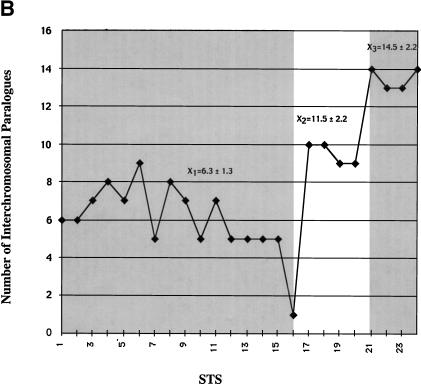
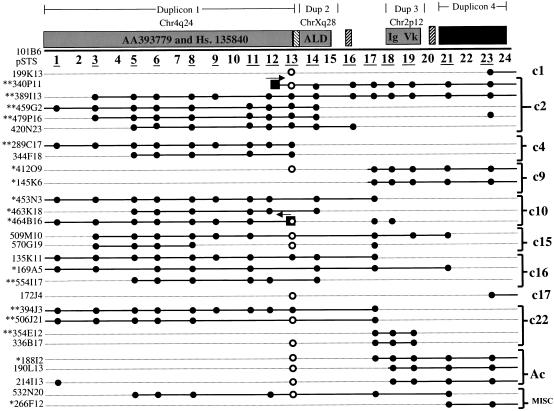
The pericentromeric regions of human chromosomes pose particular problems for both mapping and sequencing. These difficulties are due, in large part, to the presence of duplicated genomic segments that are distributed among multiple human chromosomes. To ensure contiguity of genomic sequence in these regions, we designed a sequence-based strategy to characterize different pericentromeric regions using a single (162 kb) 2p11 seed sequence as a point of reference. Molecular and cytogenetic techniques were first used to construct a paralogy map that delineated the interchromosomal distribution of duplicated segments throughout the human genome. Monochromosomal hybrid DNAs were PCR amplified by primer pairs designed to the 2p11 reference sequence. The PCR products were directly sequenced and used to develop a catalog of sequence tags for each duplicon for each chromosome. A total of 685 paralogous sequence variants were generated by sequencing 34.7 kb of paralogous pericentromeric sequence. Using PCR products as hybridization probes, we were able to identify 702 human BAC clones, of which a subset, 107 clones, were analyzed at the sequence level. We used diagnostic paralogous sequence variants to assign 65 of these BACs to at least 9 chromosomal pericentromeric regions: 1q12, 2p11, 9p11/q12, 10p11, 14q11, 15q11, 16p11, 17p11, and 22q11. Comparisons with existing sequence and physical maps for the human genome suggest that many of these BACs map to regions of the genome with sequence gaps. Our analysis indicates that large portions of pericentromeric DNA are virtually devoid of unique sequences. Instead, they consist of a mosaic of different genomic segments that have had different propensities for duplication. These biologic properties may be exploited for the rapid characterization of, not only pericentromeric DNA, but also other complex paralogous regions of the human genome.


Figures

Figure 1
Figure 1
Flowchart of pericentromeric characterization strategy.
Figure 2
Figure 2
FISH of 101B6. Hybridization of the entire insert of BAC clone, A-101B6, shows consistent fluorescent signals on 1q12, 2p11/q11, 9p12/q12–13, 10p11, 15q11/q13, 16p11/q11, and 22q11. Less intense signals are observed for 4q24 and the centromeric regions of chromosomes 7 and Y. Note the difference in size and intensity of signals on some chromosomes (compare 2 and 16), which may suggest copy number differences.
Figure 3
Figure 3
Database sequence similarity searches. The diagram depicts the extent of overlap between the (101B6) reference sequence (top solid line) and a subset (as of 12–99) of other highly paralogous (>90%) GenBank sequences (lower solid lines). Sequences with an * before them denote clones in htgs phase of GenBank. These overlaps are placed in the context of ancestral duplications from 4q24, Xq28, and 2p12 (see text). Horizontal broken lines indicate a gap in the target sequence, whereas vertical broken lines indicate the positions of repeat sequences. The paralogous nonprocessed pseudogene fragments of the adrenoleukodystrophy, AA393779 and Unigene cluster Hs. 135840, and the immunoglobulin κ-variable chain segment are shown as filled boxes. The direction of transcription (arrows) and the exon–intron structure with respect to the ancestral (expressed) sequence are indicated. GC-rich repeat elements such as the telomeric associated repeat (TAR) and GC-rich interspersed repeats are indicated by hatched boxes.
Figure 4
Figure 4
Paralogous STS and sequence variants. (a) A typical PCR amplification of a paralogous STS against a panel of monochromosomal somatic cell hybrid DNAs. pSTS1 was designed to 101B6 (chromosome 2) sequence (see Methods) yet amplified a ∼383 bp product from chromosomes 2, 4, 10, 16, 22, and Y (marked with asterisks). (b) The PCR products from pSTS 1 were bidirectionally sequenced and aligned (Consed). Basepairs in bold represent 101B6 basepairs, whereas the numbers above each bp represent its location in 101B6. Only the paralogous sequence variants (PSVs) that distinguish each chromosome are shown; a period represents the same bp as 101B6. Along the right are the sequences of the monochromosomal hybrid sequence (MCH). Below each chromosomal sequence signature, a subset of RPCI-11 BAC clones corresponding to each PSV is indicated. The numbers correspond to pSTSs developed to the 101B6 reference sequence. Similar analyses were performed for 16 other pSTS.
Figure 4
Figure 4
Paralogous STS and sequence variants. (a) A typical PCR amplification of a paralogous STS against a panel of monochromosomal somatic cell hybrid DNAs. pSTS1 was designed to 101B6 (chromosome 2) sequence (see Methods) yet amplified a ∼383 bp product from chromosomes 2, 4, 10, 16, 22, and Y (marked with asterisks). (b) The PCR products from pSTS 1 were bidirectionally sequenced and aligned (Consed). Basepairs in bold represent 101B6 basepairs, whereas the numbers above each bp represent its location in 101B6. Only the paralogous sequence variants (PSVs) that distinguish each chromosome are shown; a period represents the same bp as 101B6. Along the right are the sequences of the monochromosomal hybrid sequence (MCH). Below each chromosomal sequence signature, a subset of RPCI-11 BAC clones corresponding to each PSV is indicated. The numbers correspond to pSTSs developed to the 101B6 reference sequence. Similar analyses were performed for 16 other pSTS.
Figure 5
Figure 5
Paralogy map. (a) Summary of PCR and FISH analysis of 101B6. Each column describes the PCR results of one primer pair tested against a panel of 24 monochromosomal somatic cell hybrid DNAs. A total of 24 paralogous STS (pSTS 1–24) primer pairs were developed based on the 101B6 reference sequence. Dots along the top line indicate the approximate position of each primer pair in 101B6 (see Table 3 for the exact location of each primer). The filled gray boxes indicate chromosomal hybrids tested positive by PCR and, therefore, represent the extent of paralogy of each chromosome with respect to the 2p11 reference sequence. As expected, only chromosome 2 tested positive for all pSTS. A schematic of the duplication organization (see Fig.3) of the 2p11 sequence is provided. The positions of long-range PCR (LR-ALD, LR-1 to 4) and the cosmid (c308a5) probes used in FISH assays are indicated. FISH localizations are summarized on the right side of the figure. These confirm the interchromosomal distribution and cytogenetic position of each pSTS. (b) The number of observed interchromosomal duplications is plotted (y axis) against the position of each paralogous STS. The mean number of duplications is calculated for three groups (X1=duplicon 1 and 2, X2=duplicon 3, and X3=duplicon 4). A significant difference is observed for each pairwise comparison of the means (P < 0.001; two-tailed test; unequal variances).
Figure 5
Figure 5
Paralogy map. (a) Summary of PCR and FISH analysis of 101B6. Each column describes the PCR results of one primer pair tested against a panel of 24 monochromosomal somatic cell hybrid DNAs. A total of 24 paralogous STS (pSTS 1–24) primer pairs were developed based on the 101B6 reference sequence. Dots along the top line indicate the approximate position of each primer pair in 101B6 (see Table 3 for the exact location of each primer). The filled gray boxes indicate chromosomal hybrids tested positive by PCR and, therefore, represent the extent of paralogy of each chromosome with respect to the 2p11 reference sequence. As expected, only chromosome 2 tested positive for all pSTS. A schematic of the duplication organization (see Fig.3) of the 2p11 sequence is provided. The positions of long-range PCR (LR-ALD, LR-1 to 4) and the cosmid (c308a5) probes used in FISH assays are indicated. FISH localizations are summarized on the right side of the figure. These confirm the interchromosomal distribution and cytogenetic position of each pSTS. (b) The number of observed interchromosomal duplications is plotted (y axis) against the position of each paralogous STS. The mean number of duplications is calculated for three groups (X1=duplicon 1 and 2, X2=duplicon 3, and X3=duplicon 4). A significant difference is observed for each pairwise comparison of the means (P < 0.001; two-tailed test; unequal variances).
Figure 6
Figure 6
Identification of pericentromeric BAC clones. A total of 702 individual BAC clones were identified upon hybridization of the RPCI-11 BAC library (segments 1 and 2) with 101B6-derived probes. 107 of these clones were characterized at the sequence level with 16 of the paralogous STSs indicated by an underline. 65/107 BACs could be assigned to a chromosomal bin based on at least five diagnostic paralogous sequence variants between the BAC and monochromosomal hybrid signature. A representative subset of paralogous BACs are depicted. Filled circles show the representative STS content of each BAC based on amplification with 101B6-derived pSTSs. Open circles indicate that a product larger than expected was amplified. Asterisks indicate BACs for which one (*) or both (**) end sequences were generated. Boxes show the position of the BAC-end sequence with respect to the 101B6 reference sequence. Eleven different contig bins were created corresponding to BACs from chromosome 1, 2, 4, 9, 10, 15, 16, 17, 22, acrocentric bin (13, 14, 15, 21, 22), as well as a miscellaneous bin, which includes BACs that have not yet been assigned to a chromosome but possess a distinct paralogous sequence signature.
Figure 7
Figure 7
2p11 vs. 22q11 pericentromeric organization. Miropeat analysis was performed using the 162 kb of 2p11 reference sequence and 600 kb of finished chromosome 22 sequence contig 3. Miropeats identifies regions of sequence similarity and displays this similarity information graphically in the positional context of the sequence (vertical line) as black bars delineated by joining lines between the two sequences (http://www.genome.ou.edu/miropeats.html). Comparisons were performed using repeat-masked versions (RepeatMasker v. 3.0) of the sequences (consequently small breaks in the sequence similarity are indicated). Note the colinearity of duplicons 1 and 2 (see Fig. 3 for a detailed description of duplication content). Duplicon 3 is located 300 kb distal to the first sequence overlap in an inverted orientation. At least two rearrangement events must be invoked to account for this comparative organization. Duplicon 4, although present by monochromosomal hybrid analysis within chromosome 22 (Fig. 5a) could not be identified in any of the current finished sequence. This duplicated segment presumably lies within one of the remaining sequence gaps of 22q11.

References

    1. Amos-Landgraf JM, Ji Y, Gottlieb W, Depinet T, Wandstrat AE, Cassidy SB, Driscoll DJ, Rogan PK, Schwartz S, Nicholls RD. Chromosome breakage in the Prader-Willi and Angelman syndromes involves recombination between large, transcribed repeats at proximal and distal breakpoints. Am J Hum Genet. 1999;65:370–386. - PMC - PubMed
    1. Arnheim N, Krystal M, Schmickel R, Wilson G, Ryder O, Zimmer E. Molecular evidence for genetic exchanges among ribosomal genes on nonhomologous chromosomes in man and apes. Proc Natl Acad Sci USA. 1980;77:7323–7327. - PMC - PubMed
    1. Arnold N, Stanyon R, Jauch A, O'Brien P, Wienberg J. Identification of complex chromosome rearrangements in the gibbon by fluorescent in situ hybridization (FISH) of a human chromosome 2q specific microlibrary, yeast artificial chromosomes, and reciprocal chromosome painting. Cytogenet Cell Genet. 1996;74:80–85. - PubMed
    1. Brand-Arpon V, Rouquier S, Massa H, de Jong PJ, Ferraz C, Ioannou PA, Demaille JG, Trask BJ, Giorgi D. A genomic region encompassing a cluster of olfactory receptor genes and a myosin light chain kinase (MYLK) gene is duplicated on human chromosome regions 3q13–q21 and 3p13. Genomics. 1999;56:98–110. - PubMed
    1. Brown TA. Genomes. New York: Bios Scientific Publishers: Wiley-Liss; 1999.

Publication types

Associated data

LinkOut - more resources