. 2000 Jun;10(6):853-60.
doi: 10.1101/gr.10.6.853.

Parallel genotyping of human SNPs using generic high-density oligonucleotide tag arrays

Affiliations

Parallel genotyping of human SNPs using generic high-density oligonucleotide tag arrays

J B Fan et al. Genome Res. 2000 Jun.

Abstract

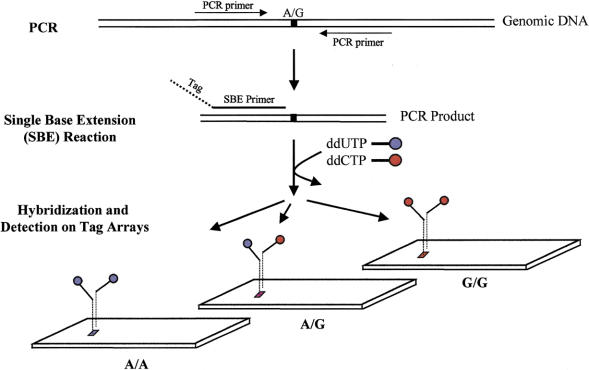
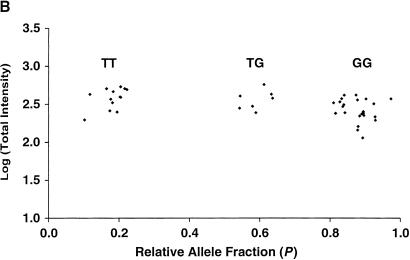
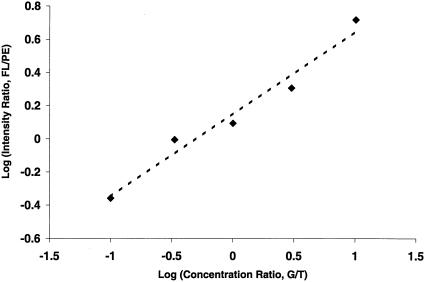
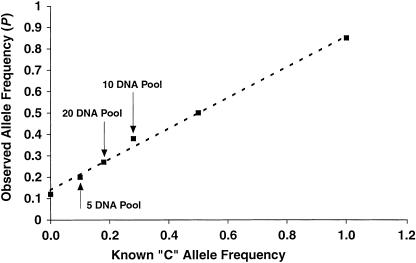
Large scale human genetic studies require technologies for generating millions of genotypes with relative ease but also at a reasonable cost and with high accuracy. We describe a highly parallel method for genotyping single nucleotide polymorphisms (SNPs), using generic high-density oligonucleotide arrays that contain thousands of preselected 20-mer oligonucleotide tags. First, marker-specific primers are used in PCR amplifications of genomic regions containing SNPs. Second, the amplification products are used as templates in single base extension (SBE) reactions using chimeric primers with 3' complementarity to the specific SNP loci and 5' complementarity to specific probes, or tags, synthesized on the array. The SBE primers, terminating one base before the polymorphic site, are extended in the presence of labeled dideoxy NTPs, using a different label for each of the two SNP alleles, and hybridized to the tag array. Third, genotypes are deduced from the fluorescence intensity ratio of the two colors. This approach takes advantage of multiplexed sample preparation, hybridization, and analysis at each stage. We illustrate and test this method by genotyping 44 individuals for 142 human SNPs identified previously in 62 candidate hypertension genes. Because the hybridization results are quantitative, this method can also be used for allele-frequency estimation in pooled DNA samples.


Figures

Figure 1
Figure 1
TAG–SBE genotyping assay. Marker-specific primers are designed for amplification of each SNP from genomic DNA (Wang et al. 1998); all SNPs with the same pair of variant bases (e.g., A/G SNPs) are pooled. The double-stranded PCR products serve as templates for the SBE reaction. Each SBE primer is chimeric with a 5' end complementary to a unique tag synthesized on the array and a 3' end complementary to the genomic sequence and terminating one base before a polymorphic SNP site. Thus, each SBE primer is uniquely associated with a specific tag (location) on the array. SBE primers corresponding to multiple markers are added to a single reaction tube and extended in the presence of pairs of ddNTPs labeled with different fluorophores; for example, an A/G bi-allelic marker is extended in the presence of biotin-labeled ddUTP and fluorescein-labeled ddCTP. The labeled multiplex SBE reaction products are pooled and hybridized to the tag array. Three hybridization patterns are shown, corresponding to three genotypes AA, AG, and GG.
Figure 2
Figure 2
(A) Fluorescence image of a small portion of an oligonucleotide tag array following hybridization of 77 labeled SBE primers. The entire array contains >32,000 20-mer tag probe pairs. The physically adjacent PM and MM probes for a single tag probe pair are labeled. (B) The fluorescence intensity pattern for a tag probe pair showing the presence of an AA homozygote, an AB heterozygote, and a BB homozygote, and the computed relative allele fraction value P = (PM−MM)fluorescein / [(PM−MM)fluorescein + (PM−MM)phycoerythrin]. Because of the partial overlap of the emission spectra of fluorescein and phycoerythrin, there is some spillover of fluorescein signal into the phycoerythrin emission channel. Background signals are subtracted and corrections for spectral overlap are applied prior to the quantitative genotyping analysis.
Figure 2
Figure 2
(A) Fluorescence image of a small portion of an oligonucleotide tag array following hybridization of 77 labeled SBE primers. The entire array contains >32,000 20-mer tag probe pairs. The physically adjacent PM and MM probes for a single tag probe pair are labeled. (B) The fluorescence intensity pattern for a tag probe pair showing the presence of an AA homozygote, an AB heterozygote, and a BB homozygote, and the computed relative allele fraction value P = (PM−MM)fluorescein / [(PM−MM)fluorescein + (PM−MM)phycoerythrin]. Because of the partial overlap of the emission spectra of fluorescein and phycoerythrin, there is some spillover of fluorescein signal into the phycoerythrin emission channel. Background signals are subtracted and corrections for spectral overlap are applied prior to the quantitative genotyping analysis.
Figure 3
Figure 3
Cluster analysis of tag array hybridization results for 44 individuals at SNP marker (A) ANPex3.33 and (B) SELP.25. The logarithm of total fluorescence intensity [(PM−MM)fluorescein + (PM−MM)phycoerythrin] for each of the 44 hybridizations is plotted against the calculated relative allele fraction value P. The three distinct clusters observed correspond to the genotypes T/T, T/C, and C/C for marker ANPex3.33, and T/T, T/G, and G/G for marker SELP.25.
Figure 3
Figure 3
Cluster analysis of tag array hybridization results for 44 individuals at SNP marker (A) ANPex3.33 and (B) SELP.25. The logarithm of total fluorescence intensity [(PM−MM)fluorescein + (PM−MM)phycoerythrin] for each of the 44 hybridizations is plotted against the calculated relative allele fraction value P. The three distinct clusters observed correspond to the genotypes T/T, T/C, and C/C for marker ANPex3.33, and T/T, T/G, and G/G for marker SELP.25.
Figure 4
Figure 4
Quantitative allele frequency estimation based on two-color analysis of synthetic mixed templates. The two templates were mixed in the ratios of 1 nM/10 nM, 1 nM/3 nM, 1 nM/1 nM, 3 nM/1 nM, and 10 nM/1 nM, respectively. The logarithm of intensity ratios of the two colors (Y-axis) are plotted against the logarithm of concentration ratios of the two mixed templates (X-axis). FL, fluorescein intensity; PE, phycoerythrin intensity; G/T, concentration ratio of template G to template T.
Figure 5
Figure 5
Allele frequency estimation for individual homozygotes, heterozygotes, and collections of multiple individuals at the SNP marker ANPex3.33. For the pooled samples, genomic DNA from a group of 5, 10, and 20 individuals (C-allele frequencies of 0.10, 0.28, and 0.18, respectively) was pooled in equal amounts and treated in the same way as the samples from single individuals. The observed allele fraction value P is plotted against the known C allele frequency, along with the best fit line as a guide to the eye. The line intercepts the Y-axis above the origin, and this systematic offset is the result of a small amount of cross-hybridization and misincorporation of the wrong base in the two-color SBE reaction. A correction can be applied to the data following the observation of pure genotypes to obtain a more accurate estimate of the absolute allele frequencies.

Similar articles

Cited by

References

    1. Cargill M, Altshuler D, Ireland J, Sklar P, Ardlie K, Patil N, Lane CR, Lim EP, Kalayanaraman N, Nemesh J, et al. Characterization of single-nucleotide polymorphisms in coding regions of human genes. Nature Genet. 1999;22:231–238. - PubMed
    1. Chakravarti A. Population genetics–making sense out of sequence. Nature Genet. 1999;21:56–60. - PubMed
    1. Chee M, Yang R, Hubbell E, Berno A, Huang XC, Stern D, Winkler J, Lockhart DJ, Morris MS, Fodor SP. Accessing genetic information with high-density DNA arrays. Science. 1996;274:610–614. - PubMed
    1. Chen X, Kwok PY. Template-directed dye-terminator incorporation (TDI) assay: a homogeneous DNA diagnostic method based on fluorescence resonance energy transfer. Nucleic Acids Res. 1997;25:347–353. - PMC - PubMed
    1. Chen X, Zehnbauer B, Gnirke A, Kwok PY. Fluorescence energy transfer detection as a homogeneous DNA diagnostic method. Proc Natl Acad Sci . 1997;94:10756–10761. - PMC - PubMed

Publication types