. 2000 Jun 15;525 Pt 3(Pt 3):655-67.
doi: 10.1111/j.1469-7793.2000.00655.x.

Adenosine A1 receptors modulate high voltage-activated Ca2+ currents and motor pattern generation in the xenopus embryo

Affiliations

Adenosine A1 receptors modulate high voltage-activated Ca2+ currents and motor pattern generation in the xenopus embryo

P Brown et al. J Physiol. .

Abstract

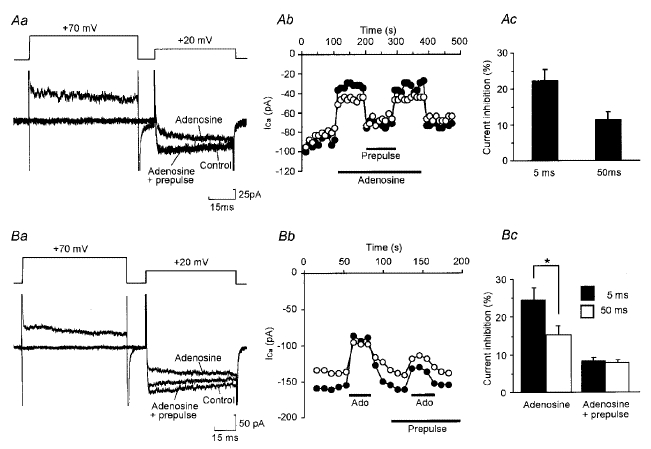
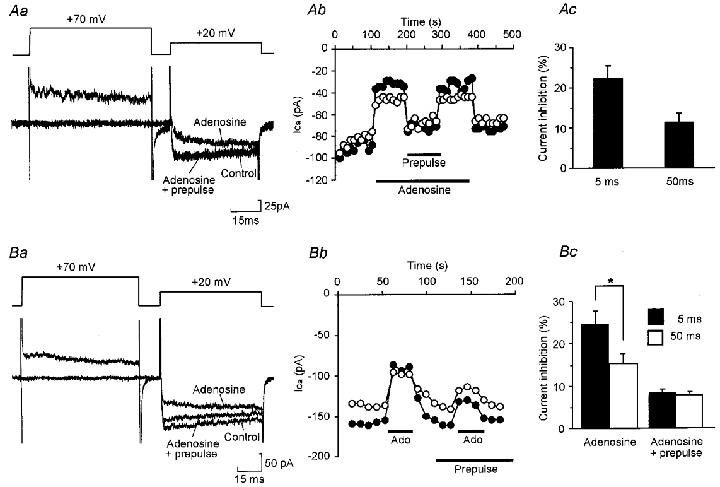
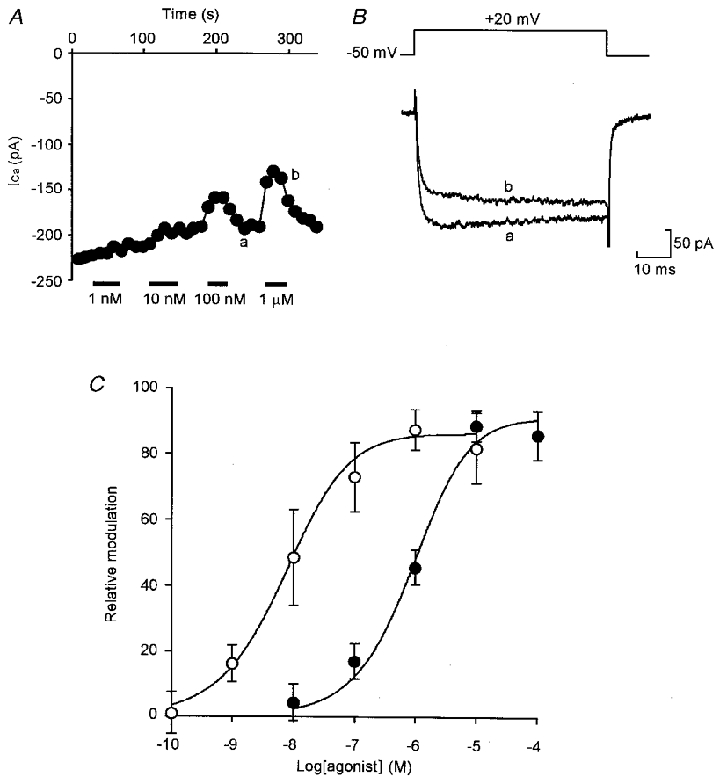
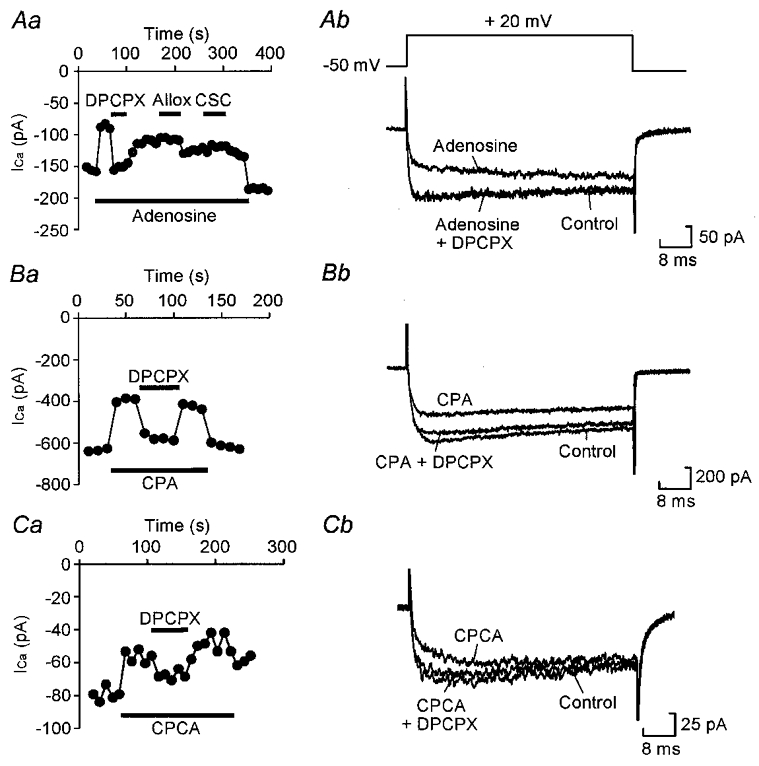
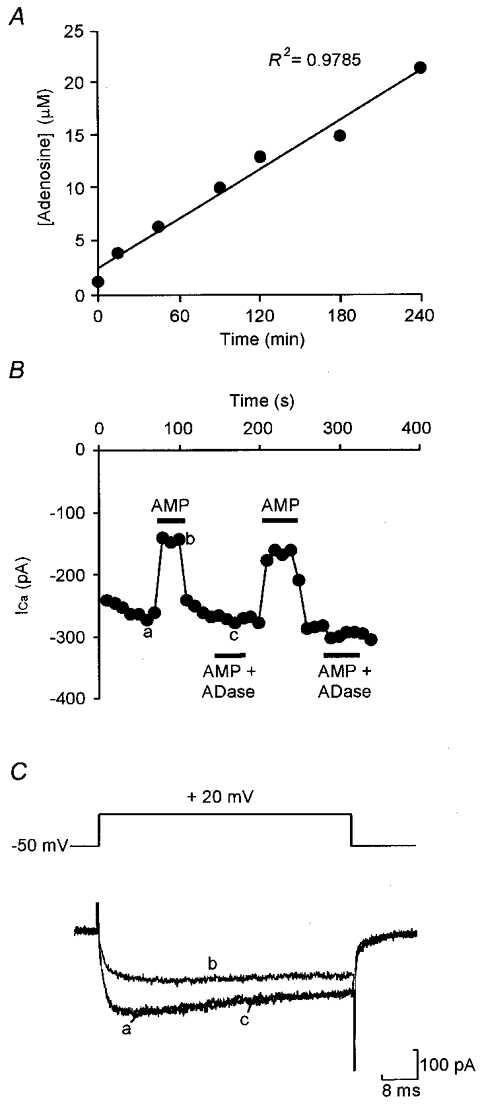
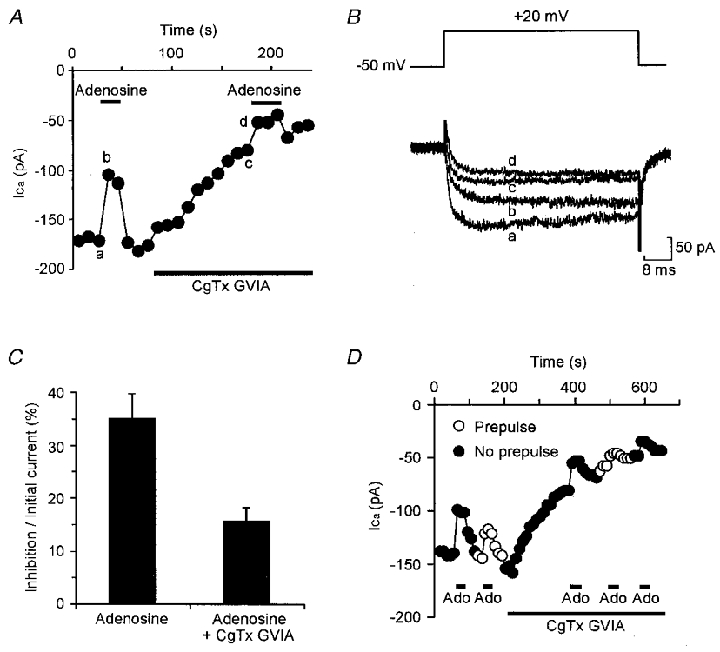
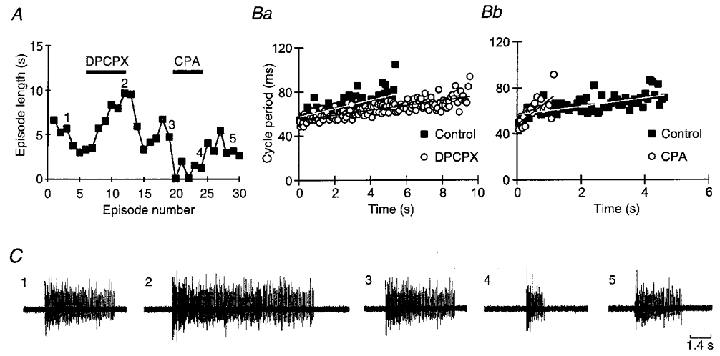
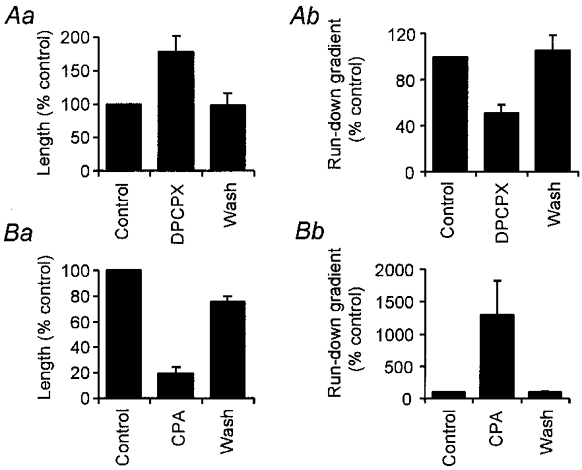
Adenosine causes voltage- and non-voltage-dependent inhibition of high voltage-activated (HVA) Ca2+ currents in Xenopus laevis embryo spinal neurons. As this inhibition can be blocked by 8-cyclopentyl-1, 3-dipropylxanthine (DPCPX) and mimicked by N6-cyclopentyladenosine (CPA) it appears to be mediated by A1 receptors. Agents active at A2 receptors either were without effect or could be blocked by DPCPX. AMP had no agonist action on these receptors. By using omega-conotoxin GVIA we found that adenosine inhibited an N-type Ca2+ current as well as a further unidentified HVA current that was insensitive to dihydropyridines, omega-agatoxin TK and omega-conotoxin MVIIC. Both types of current were subject to voltage- and non-voltage-dependent inhibition. We used CPA and DPCPX to test whether A1 receptors regulated spinal motor pattern generation in spinalized Xenopus embryos. DPCPX caused a near doubling of, while CPA greatly shortened, the length of swimming episodes. In addition, DPCPX slowed, while CPA greatly speeded up, the rate of run-down of motor activity. Our results demonstrate a novel action of A1 receptors in modulating spinal motor activity. Furthermore they confirm that adenosine is produced continually throughout swimming episodes and acts to cause the eventual termination of activity.


Figures

Figure 1
Figure 1. Adenosine causes dose-dependent inhibition of HVA Ca2+ currents
A, graph showing the effect of application of adenosine at doses between 100 nM and 100 μM on the amplitude of HVA currents, measured 5 ms after activation of the current, evoked by a series of voltage steps from -50 to +20 mV delivered once every 10 s. B, representative current records from times a and b in A. C, logdose-response curve for adenosine. Points represent mean current inhibition (±s.e.m.) normalized to the inhibition obtained at the highest dose of adenosine. The curve was fitted using the Hill equation (Hill coefficient = 1.51, IC50= 1.2 μM).
Figure 2
Figure 2. Inhibition of HVA Ca2+ currents occurs through voltage- and non-voltage-dependent mechanisms
Aa, current record from a cell in which a prepulse totally relieved modulation by 10 μM adenosine of HVA currents evoked by a voltage step from -50 to +20 mV. Ab, time series showing the effect of adenosine and a prepulse on HVA currents measured every 10 s in the same cell. •, current measured 5 ms into the test pulse; ○, current measured 50 ms into the test pulse. Ac, summary histogram of 21 cells in which a prepulse totally abolished modulation. Modulation 5 ms into the test voltage pulse was significantly greater than that at 50 ms (P < 0.01, paired t test). B, as for panels in A except records are from a cell in which a prepulse only partially relieved modulation by 10 μM adenosine (Ado). For c, 18 cells. Total modulation 5 ms into the test voltage pulse was significantly greater than that at 50 ms (*P < 0.01, paired t test). However, for the ‘steady state’ voltage-independent modulation not relieved by a prepulse, there was no significant difference between that measured at 5 ms and that measured at 50 ms.
Figure 3
Figure 3. A1 receptors mediate inhibition of HVA currents
A, graph showing the dose-dependent effect of the A1-selective agonist CPA on the amplitude of HVA currents evoked by a series of steps from -50 to +20 mV delivered once every 20 s. The points represent the current measured 5 ms into the voltage step. B, representative current records from times a and b in A showing the effect of 1 μM CPA. C, logdose-response curve for CPA (○) and the A2-selective agonist CPCA (•). Error bars represent s.e.m. Curves were fitted using the Hill equation (Hill coefficient = 0.79 and IC50= 6.9 nM for CPA; Hill coefficient = 0.9 and IC50= 896 nM for CPCA).
Figure 4
Figure 4. Modulation of Ca2+ currents by adenosine is blocked by A1 but not A2 antagonists
Aa, graph showing the effect of the A1 antagonist DPCPX (100 nM) and the A2 antagonists alloxazine (Allox, 100 nM) and CSC (100 nM) on inhibition by 10 μM adenosine of current evoked by a series of steps from -50 to +20 mV once every 10 s. Current was measured 5 ms into the voltage step. DPCPX totally abolished the modulation, whereas alloxazine (Allox) and CSC were without effect. Ab, representative current records from the same cell showing total block of modulation by DPCPX. Ba, modulation by 100 nM CPA is also blocked by 100 nM DPCPX. Bb, representative current records from the same cell. Ca, modulation by 10 μM CPCA is also blocked by 100 nM DPCPX, indicating that this agonist cross-activates the A1 receptor. Cb, representative current records from the same cell.
Figure 5
Figure 5. AMP is unstable but has no agonist action
A, a 100 μM solution of commercial AMP in recording saline was initially contaminated with 1.3 μM adenosine, measured by reverse phase HPLC analysis, which increased to 21.4 μM over 4 h when kept under experimental conditions. B, a solution of 100 μM AMP caused modulation of HVA currents evoked by a series of steps from -50 to +20 mV at 0.1 Hz, but treatment with adenosine deaminase (ADase) to remove the contaminating adenosine abolished modulation. Current was measured 5 ms into the voltage step. C, representative current traces from the same cell, times a-c in B showing that the inibition of Ca2+ currents by untreated AMP solutions looks very similar to the inhibition evoked by adenosine.
Figure 6
Figure 6. Adenosine inhibits N-type and unidentified HVA currents
A, graph showing the amplitude of Ca2+ currents evoked by a series of steps from -50 to +20 mV once every 10 s. The inhibition evoked by 10 μM adenosine was partially occluded once 1 μM CgTx GVIA had been added to block the N-type current. B, representative current records from the same cell times a-d in A. C, summary histogram of 10 cells in which modulation before block was compared with modulation after block, expressed as a percentage of the unblocked current. Modulation was significantly reduced (P < 0.01, paired t test). D, prepulses partially relieved inhibition by adenosine (Ado) both before and after current block by CgTx GVIA, indicating that both voltage-dependent and -independent modulation are partially occluded by block of the N-type current.
Figure 7
Figure 7. A1 receptors modulate swimming episodes
A, graph showing the length of all swimming episodes in an experiment where 500 nM DPCPX and 100 nM CPA were applied. DPCPX resulted in a doubling of episode length whereas CPA greatly shortened episodes. The numbers on the graph refer to the sample records in control, DPCPX, wash, CPA and wash shown in C. Ba and b illustrate how DPCPX and CPA, respectively, alter the time-dependent lengthening of cycle periods during swimming (run-down). Each graph shows a plot of cycle period versus time for control and drug (episodes 1 and 2, 3 and 4, respectively, from C). Linear regression lines fitted to the data show how the rate of run-down is altered by the treatments. Wash caused complete reversal of these effects but is not shown for clarity.
Figure 8
Figure 8. Both episode length and the rate of run-down (as measured by the time-dependent lengthening of cycle period during swimming) are controlled by A1 receptors
Summary histograms showing the effects of DPCPX and CPA on episode length (Aa and Ba, respectively) and run-down (Ab and Bb, respectively).

References

    1. Agarwhal RP, Parks RE. Adenosine deaminase from human erythrocytes. Methods in Enzymology. 1978;51:502–507. - PubMed
    1. Ambrosio AF, Malva JO, Carvalho AP, Carvalho CM. Modulation of Ca2+ channels by activation of adenosine A1 receptors in rat striatal glutamatergic nerve terminals. Neuroscience Letters. 1996;220:163–166. - PubMed
    1. Ambrosio AF, Malva JO, Carvalho AP, Carvalho CM. Inhibition of N- and P/Q- and other types of Ca2+ channel in rat hippocampal nerve terminals by the adenosine A1 receptor. European Journal of Pharmacology. 1997;340:301–310. - PubMed
    1. Burnstock G, Wood JN. Purinergic receptors – their role in nociception and primary afferent neurotransmission. Current Opinion in Neurobiology. 1996;6:526–532. - PubMed
    1. Chen G, Van Den Pol AN. Adenosine modulation of calcium currents and presynaptic inhibition of GABA release in suprachiasmatic and arcuate nucleus neurones. Journal of Neurophysiology. 1997;77:3035–3047. - PubMed

Publication types

MeSH terms

LinkOut - more resources