Comparative Study
. 2000 Sep 8;275(36):28006-16.
doi: 10.1074/jbc.M004008200.

Purification and mass spectrometry of six lipid A species from the bacterial endosymbiont Rhizobium etli. Demonstration of a conserved distal unit and a variable proximal portion

Affiliations
Comparative Study

Purification and mass spectrometry of six lipid A species from the bacterial endosymbiont Rhizobium etli. Demonstration of a conserved distal unit and a variable proximal portion

N L Que et al. J Biol Chem. .

Abstract

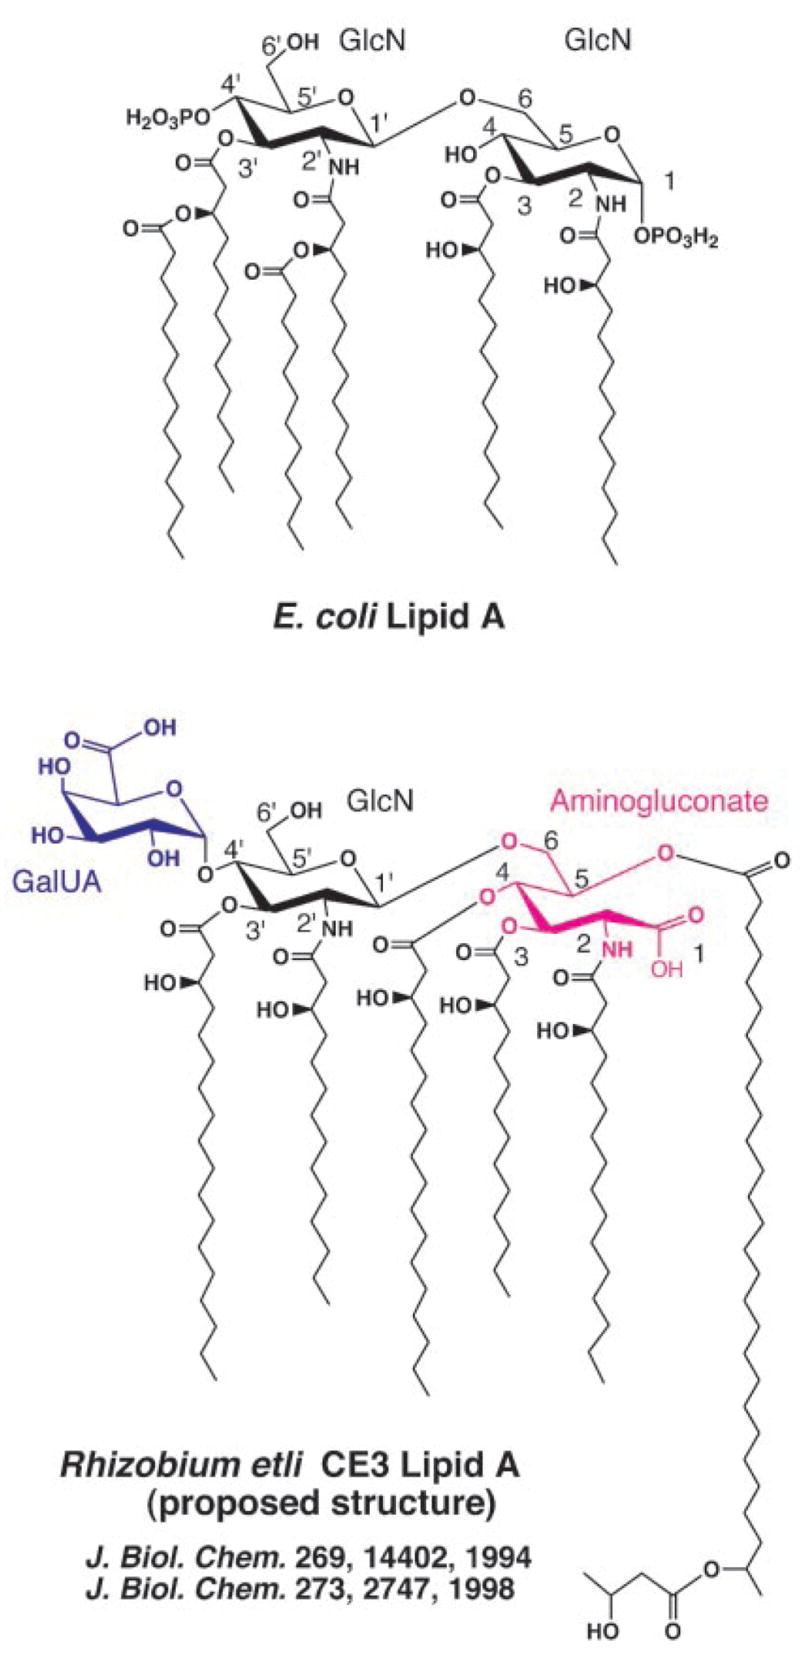
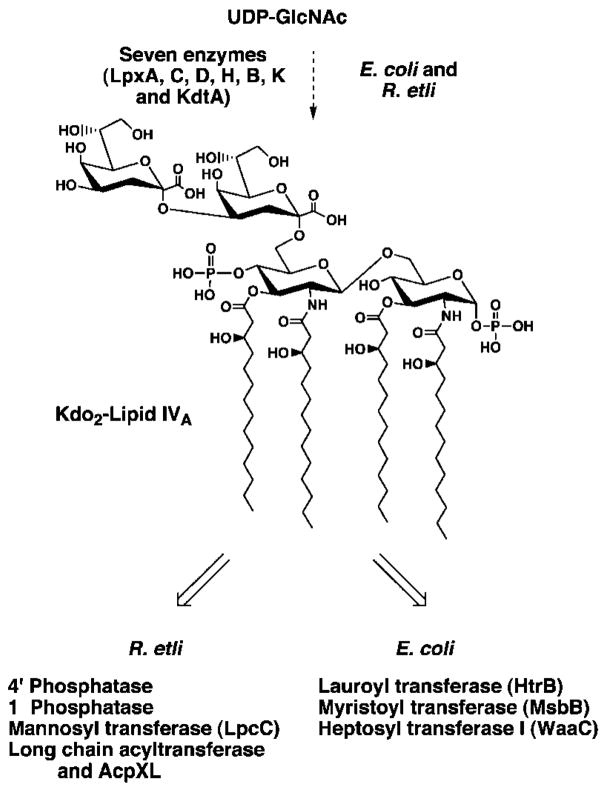
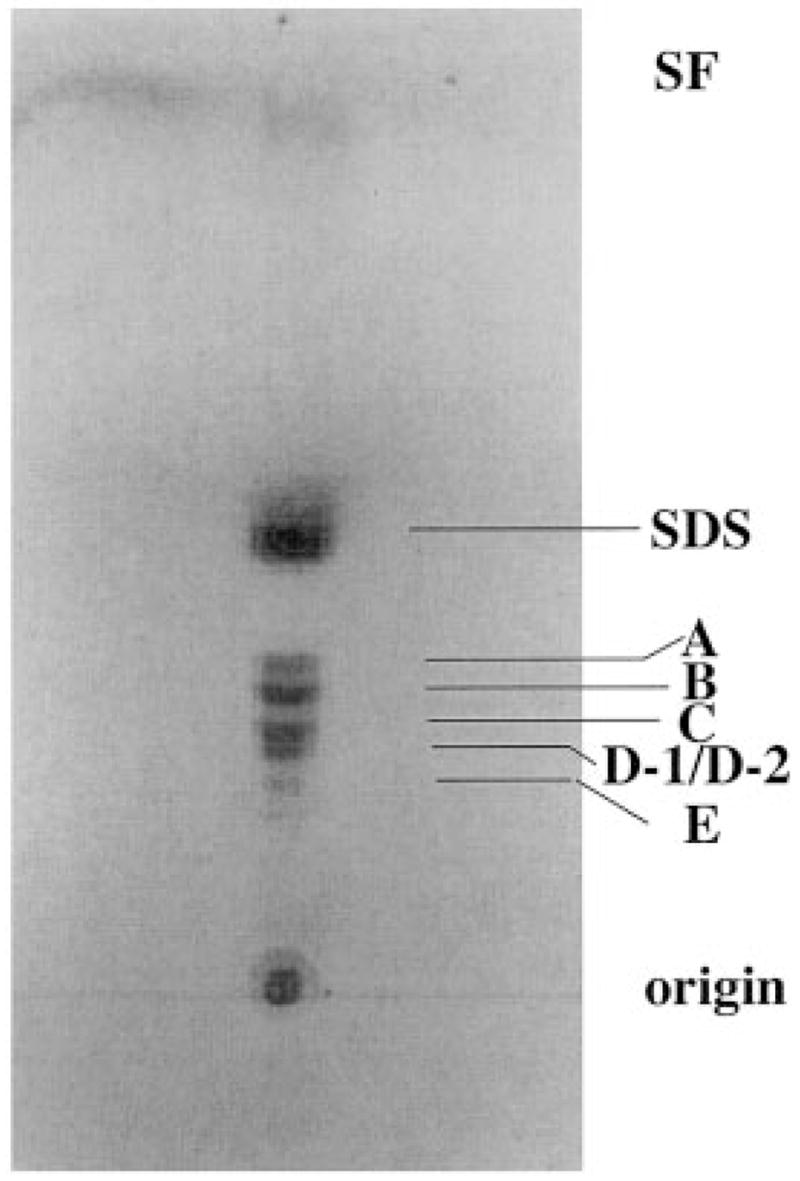
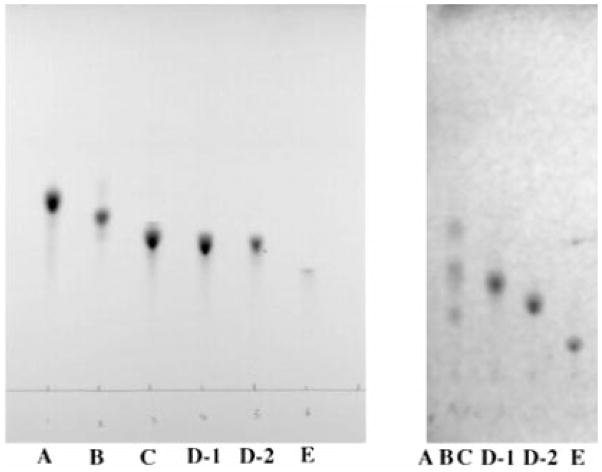
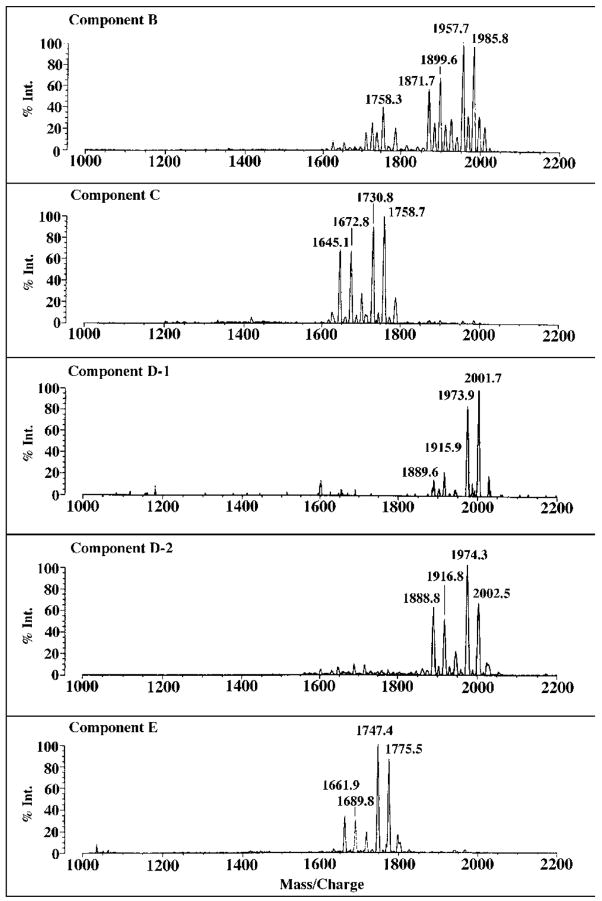
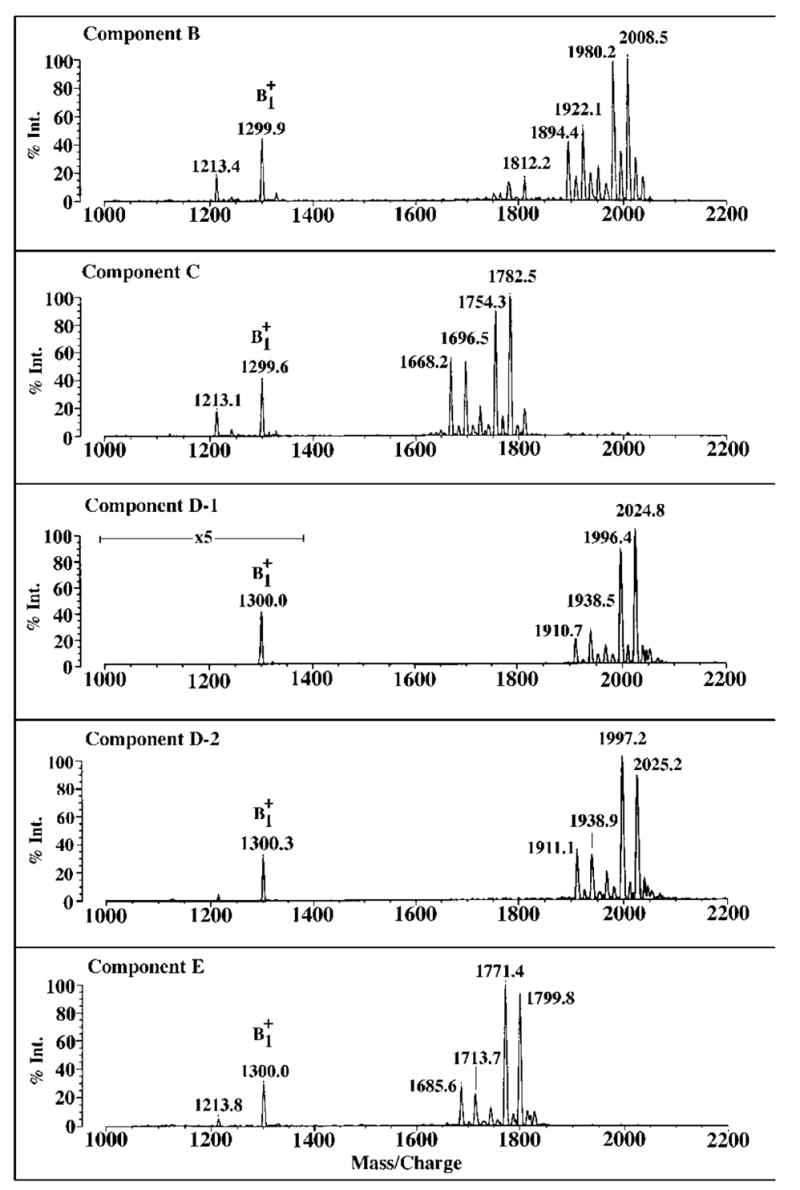
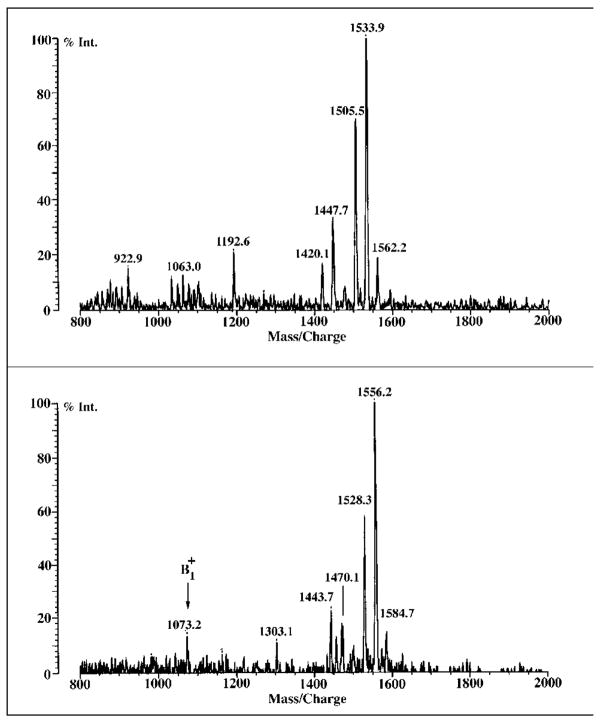
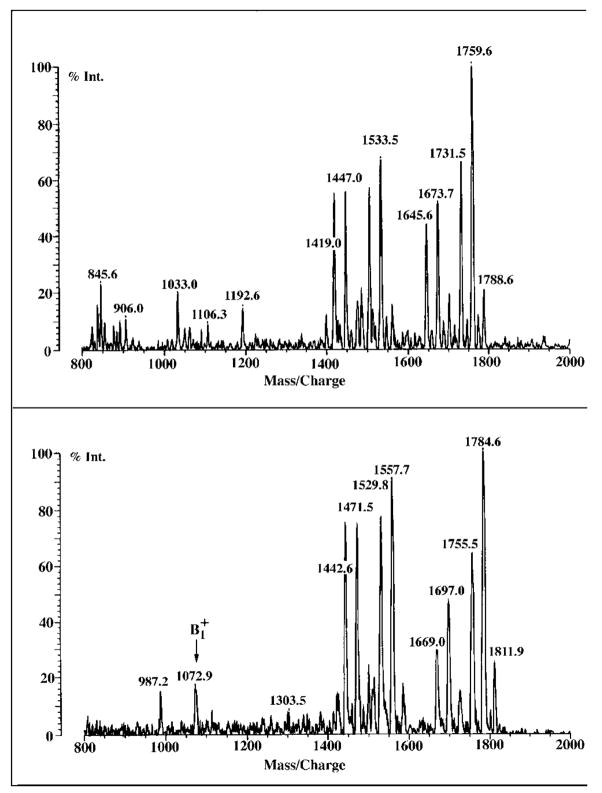
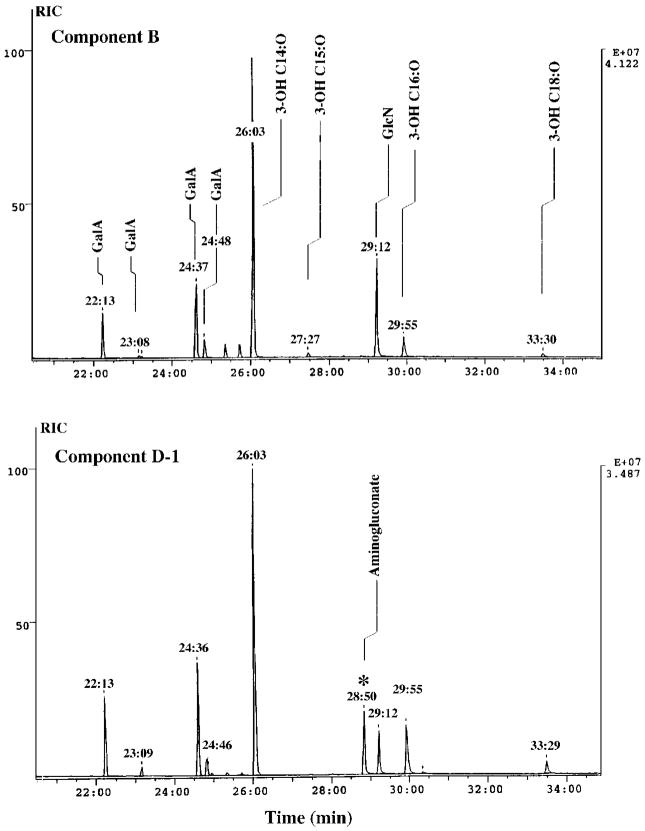
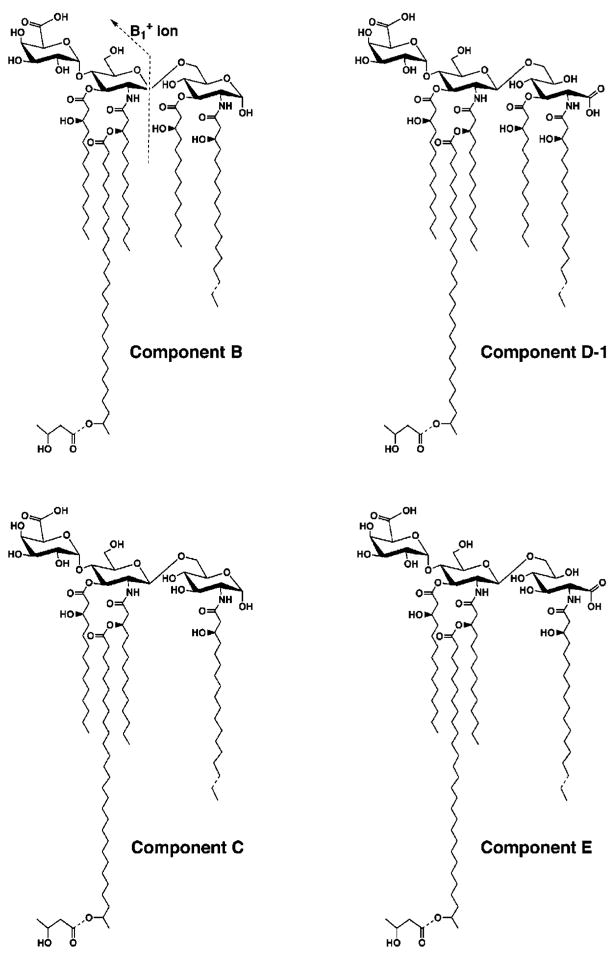
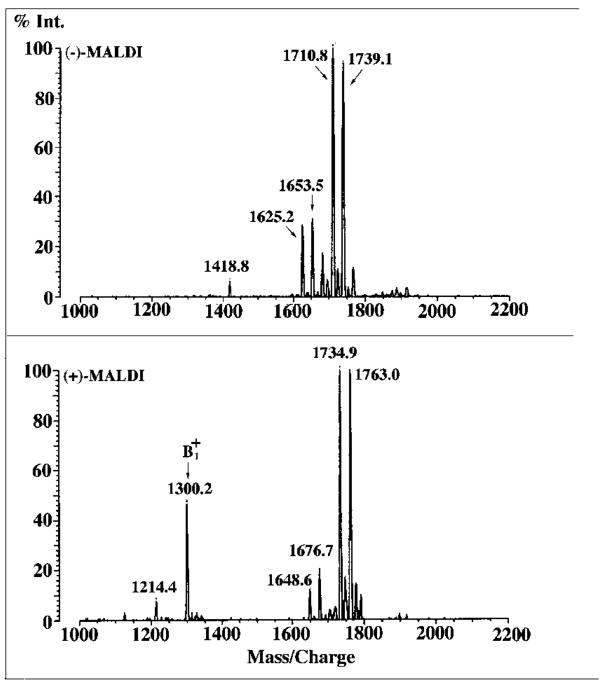
Lipid A of Rhizobium etli CE3 differs dramatically from that of other Gram-negative bacteria. Key features include the presence of an unusual C28 acyl chain, a galacturonic acid moiety at position 4', and an acylated aminogluconate unit in place of the proximal glucosamine. In addition, R. etli lipid A is reported to lack phosphate and acyloxyacyl residues. Most of these remarkable structural claims are consistent with our recent enzymatic studies. However, the proposed R. etli lipid A structure is inconsistent with the ability of the precursor (3-deoxy-D-manno-octulosonic acid)(2)-4'-(32)P-lipid IV(A) to accept a C28 chain in vitro (Brozek, K. A., Carlson, R. W., and Raetz, C. R. H. (1996) J. Biol. Chem. 271, 32126-32136). To re-evaluate the structure, CE3 lipid A was isolated by new chromatographic procedures. CE3 lipid A is now resolved into six related components. Aminogluconate is present in D-1, D-2, and E, whereas B and C contain the typical glucosamine disaccharide seen in lipid A of most other bacteria. All the components possess a peculiar acyloxyacyl moiety at position 2', which includes the ester-linked C28 chain. As judged by mass spectrometry, the distal glucosamine units of A through E are the same, but the proximal units are variable. As described in the accompanying article (Que, N. L. S., Ribeiro, A. A., and Raetz, C. R. H. (2000) J. Biol. Chem. 275, 28017-28027), the discovery of component B suggests a plausible enzymatic pathway for the biosynthesis of the aminogluconate residue found in species D-1, D-2, and E of R. etli lipid A. We suggest that the unusual lipid A species of R. etli might be essential during symbiosis with leguminous host plants.


Figures

Fig. 1
Fig. 1. Structure of E. coli lipid A compared with the previously published structure of R. etli CE3 lipid A
The backbone carbons are numbered on the assumption that the proximal aminogluconate moiety of R. etli lipid A is derived from a lipid A precursor common to both systems, such as Kdo2-lipid IVA, in which the proximal unit is not an aminogluconate moiety but glucosamine. The molecular weight of E. coli lipid A is 1798.8, whereas that of the previously proposed (33, 34) R. etli CE3 lipid A species shown above is predicted to be 2313.31.
Fig. 2
Fig. 2. Structure of the conserved intermediate Kdo2-lipid IVA and its enzymatic processing in extracts of R. etli versus E. coli
The key known enzymatic steps in the processing of Kdo2-lipid IVA in extracts of R. etli versus E. coli are indicated. The E. coli extracts do not contain the enzymes unique to R. etli that act on Kdo2-lipid IVA and vice versa.
Fig. 3
Fig. 3. Microheterogeneity of lipid A components released from R. etli cells by hydrolysis in sodium acetate buffer at pH 4.5
Approximately 2 μg of lipid substances released by hydrolysis of solvent extracted cells were spotted onto a silica TLC plate, which was developed in the solvent CHCl3/MeOH/H2O/NH4OH (40:25:4:2 v/v/v/v). After drying, the lipids were detected by charring with a spray containing 10% sulfuric acid in ethanol. SF designates the solvent front.
Fig. 4
Fig. 4. Thin layer analysis of the lipid A components purified from R. etli
A, samples of purified components (~0.2–1 μg each) were spotted, as indicated. The solvent system consisted of CHCl3/MeOH/H2O/NH4OH (40:25:4:2 v/v/v/v), as in Fig. 3. B, purified components were analyzed by silica TLC in the solvent system CHCl3/pyridine/formic acid/MeOH/H2O (60:35:10:5:2 v/v). ABC is a mixture of components A, B, and C in which the most rapidly migrating material is component A, the middle band is B, and the slowest migrating band is C. The bands were detected by charring with 10% sulfuric acid in ethanol, as in Fig. 3.
Fig. 5
Fig. 5. Negative ion MALDI/TOF mass spectra of purified R. etli CE3 lipid A components
Evidence for heterogeneity in fatty acid chain length (14 or 28 atomic mass units) and partial substitution with β-hydroxybutyrate (86 atomic mass units) is observed in all the samples. C and E differ from B and D-1/D-2 respectively by the absence of one hydroxymyristoyl unit (~226 atomic mass units), whereas the molecular species in D-1/D-2 and E are ~16 atomic mass units larger than their counterparts in B and C, respectively.
Fig. 6
Fig. 6. Positive ion MALDI/TOF mass spectra of purified R. etli CE3 lipid A components
Each of the purified components display a prominent B1+ ion near m/z 1299.8 atomic mass units, corresponding to the molecular weight of the conserved distal portion of these molecules, as illustrated in Fig. 10.
Fig. 7
Fig. 7. MALDI/TOF mass spectra of 3′-O-deacylated component C
When subjected to mild NH4OH-containing solvents during preparative TLC, component C is slowly deacylated at the 3′ position. The positive ion MALDI/TOF spectrum confirms that the B1+ ion generated from this deacylated material is ~226 atomic mass units smaller than that of component C (Fig. 6), corresponding to the loss of a β-hydroxymyristoyl moiety. Upper panel, negative ion spectrum; lower panel, positive ion spectrum.
Fig. 8
Fig. 8. MALDI/TOF mass spectra of 3′-O-deacylated component B
When subjected to NH4OH-containing solvents during preparative TLC, component B, like C (Fig. 7), is slowly deacylated at the 3′ position, with the loss of a β-hydroxymyristoyl unit (~226 atomic mass units). Upper panel, negative ion spectrum; lower panel, positive ion spectrum.
Fig. 9
Fig. 9. Sugar and fatty acid compositions of components B and D-1
Tri-methysilyl ether derivatives of the N-acetylated methyl glycosides and the fatty acid methyl esters obtained by methanol-HCl hydrolysis of purified components B and D-1 were separated by gas-liquid chromatography. Each peak was identified by comparison of its retention time with standards and by the fragmentation patterns observed during electron impact and chemical ionization mass spectrometry (not shown).
Fig. 10
Fig. 10. Proposed covalent structures of components B, C, D-1, and E of R. etli CE3 lipid A
Components B and C contain a glucosamine disaccharide unit, typical of most known lipid A molecules, including that of E. coli. Evidence for the β, 1′-6 linkage in B and C, and for the absence of an acyl chain at position 3 in C, is provided by the NMR studies in the accompanying article (73). Components D-1, D-2 (not shown), and E are proposed to contain an aminogluconate residue in place of the proximal glucosamine. D-1 and D-2 have the same molecular masses (as judged by the MALDI/TOF analysis), but they appear to be interconverted during prolonged incubation at room temperature in aqueous buffers and organic solvents. This process probably results from the migration of the fatty acyl at the C-3 position in D-1 to the C-5 position of the aminogluconate residue to generate D-2 (not shown). Acyl chain migration is known to occur in mono-acylated derivatives of UDP-N-acetylglucosamine (54), which are early intermediates in the lipid A pathway. The predominant substances that are isolated from cells are B and D-1/D-2. All components, including A, have the same distal unit, as indicated by the common B1+ ion fragments in Figs. 6 and 11. Dashed bonds indicate microheterogeneity with respect to acyl chain lengths and the presence or absence of the β-hydroxybutyrate substituent. The molecular weights calculated in Table I are those of the species with the longer acyl chains at position 2 and those that are decorated with the β-hydroxybutyrate group.
Fig. 11
Fig. 11. MALDI/TOF mass spectra of component A
Upper panel, negative ion spectrum; lower panel, positive ion spectrum. Exactly the + fragment ion is observed in the positive ion spectrum of A as same B1+ in the positive ion spectra of components B–E (Fig. 6).

References

    1. Raetz CRH. Annu Rev Biochem. 1990;59:129–170. - PubMed
    1. Raetz CRH. J Bacteriol. 1993;175:5745–5753. - PMC - PubMed
    1. Schnaitman CA, Klena JD. Microbiol Rev. 1993;57:655–682. - PMC - PubMed
    1. Rietschel ET, Kirikae T, Schade FU, Mamat U, Schmidt G, Loppnow H, Ulmer AJ, Zähringer U, Seydel U, Di Padova F, Schreier M, Brade H. FASEB J. 1994;8:217–225. - PubMed
    1. Whitfield C. Trends Microbiol. 1995;3:178–185. - PubMed

Publication types