Clinical Trial
. 2000 Jul;44(7):1869-73.
doi: 10.1128/AAC.44.7.1869-1873.2000.

Correlation between pretreatment levels of interferon response genes and clinical responses to an immune response modifier (Imiquimod) in genital warts

Affiliations
Clinical Trial

Correlation between pretreatment levels of interferon response genes and clinical responses to an immune response modifier (Imiquimod) in genital warts

I Arany et al. Antimicrob Agents Chemother. 2000 Jul.

Abstract

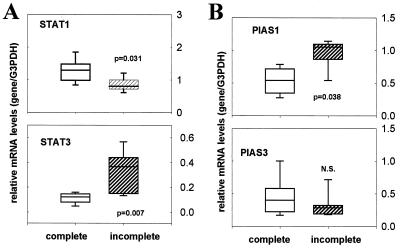
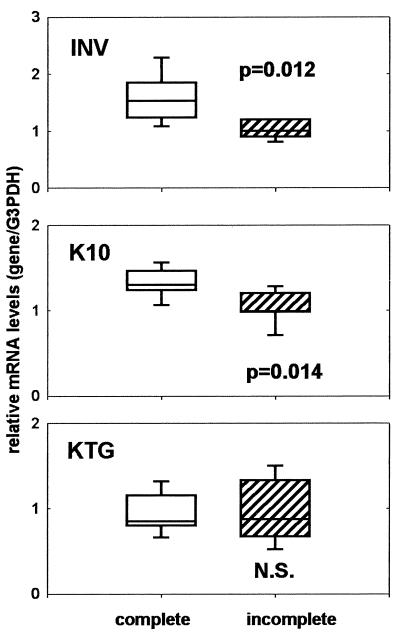
Imiquimod (IQ) has been successfully used in treatment of genital warts. In clinical settings, patients responded well but wart reduction rates varied. Our aim was to find a correlation between clinical responses and pretreatment (constitutive) levels of genes that might be involved in the molecular action of IQ. Since IQ is a cytokine inducer, we analyzed levels of expression of genes of the JAK/STAT signaling pathway and their inhibitors as well as interferon response factors (IRFs) in pretreatment biopsy specimens from complete responders (99 to 100% wart reduction rate) versus incomplete responders (75 to 92% wart reduction rate) by reverse transcription-PCR. We found that mRNA levels of signal transducer and activator of transcription 1 (STAT1) and IRF1 were higher in complete responders than in incomplete responders. Incomplete responders expressed larger amounts of STAT3, IRF2, and protein inhibitor of activated STAT1 (PIAS1) mRNAs compared to complete responders before IQ treatment. We hypothesize that high-level expression of STAT1 and IRF1 is advantageous for a better IQ response. The observed differences in constitutive mRNA levels of these genes may be the consequence of alterations in cellular differentiation and/or variable expression of endogenous interferons. Previous in vitro studies showed that keratinocyte differentiation coordinates the balance between positive and negative signals along the JAK/STAT pathway by regulating the IRF1:IRF2 and STAT1:PIAS1 ratios and thus affecting induction of IQ-inducible genes. Specifically, differentiation supports constitutive expression of STAT1 and IRF1 mRNAs but not expression of IRF2 and PIAS1. Our data are in good agreement with studies that showed the importance of STAT1 in cytokine induction and activation of interferon-responsive genes by IQ.


Figures

FIG. 1
FIG. 1
Representative RT-PCR results for STAT1 in various biopsy specimens. mRNAs from biopsy specimens from complete responders (A) and incomplete responders (B) were reverse transcribed and then PCR amplified, using gene-specific primer pairs. PCR fragments were resolved on a 1.5% agarose gel in Tris-borate-EDTA. Fragments were transferred to a nylon membrane and then hybridized with gene-specific probes prior to autoradiography. This figure shows results for STAT1 as well as the constitutively expressed G3PDH. Quantitation is seen in Fig. 2.
FIG. 2
FIG. 2
mRNA levels of STATs (A) and inhibitors of JAK/STAT signaling (B) in wart biopsy specimens before IQ treatment. Biopsy specimens from complete responders and from incomplete responders were analyzed by a semiquantitative RT-PCR method. cDNAs were obtained from the isolated RNAs by RT and subjected to PCR with gene-specific primer pairs. PCR fragments were resolved on an agarose gel and transferred to a nylon membrane. Hybridization with gene-specific probes and subsequent autoradiography revealed the identities of fragments, and quantitation was done by densitometry. Data are expressed as ratios of target gene and G3PDH mRNA levels. Data were plotted as box plots and analyzed for statistical differences. The box extends from the 5th to the 95th percentile; the horizontal line indicates the median, and the error bars show the range of the data. N.S., not significant.
FIG. 3
FIG. 3
mRNA levels of IRFs (A) and endogenous IFNs (B) in wart biopsy specimens before IQ treatment. Biopsy specimens from complete responders and from incomplete responders were analyzed by a semiquantitative RT-PCR method. cDNAs were obtained from the isolated RNAs by RT and subjected to PCR with gene-specific primer pairs. PCR fragments were resolved on an agarose gel and transferred to a nylon membrane. Hybridization with gene-specific probes and subsequent autoradiography revealed the identities of fragments, and quantitation was done by densitometry. Data are expressed as ratios of target gene and G3PDH mRNA levels. Data were plotted as box plots and analyzed for statistical differences. The box extends from the 5th to the 95th percentile; the horizontal line indicates the median, and the error bars show the range of the data.
FIG. 4
FIG. 4
Analysis of status of differentiation in wart biopsy specimens. Biopsy specimens from complete responders and from incomplete responders were analyzed by a semiquantitative RT-PCR method. cDNAs were obtained from the isolated RNAs by RT and subjected to PCR with gene-specific primer pairs. PCR fragments were resolved on an agarose gel and transferred to a nylon membrane. Hybridization with gene-specific probes and subsequent autoradiography revealed the identities of fragments, and quantitation was done by densitometry. Data are expressed as ratios of target gene and G3PDH mRNA levels. Data were plotted as box plots and analyzed for statistical differences. The box extends from the 5th to the 95th percentile; the horizontal line indicates the median, and the error bars show the range of the data. N.S., not significant; INV, involucrin; K10, keratin 10; KTG, keratinocyte transglutaminase.
FIG. 5
FIG. 5
Impact of cellular differentiation on constitutive and IQ-induced mRNA expression of IFN-responsive genes in vitro. (A) Primary normal human keratinocytes were cultured under non-differentiation-inducing or differentiation-inducing conditions as described in Materials and Methods. Constitutive mRNA levels of STATs, IRFs, and PIASs were determined by RT-PCR. cDNAs were obtained from the isolated RNAs by RT and subjected to PCR with gene-specific primer pairs. PCR fragments were resolved on an agarose gel and transferred to a nylon membrane. Hybridization with gene-specific probes and subsequent autoradiography revealed the identities of fragments, and quantitation was done by densitometry. mRNA levels are expressed as ratios of mRNA levels of target gene and a constitutively expressed gene (encoding G3PDH). (B) Keratinocytes were treated with 5 μg of IQ/ml for 72 h under non-differentiation-inducing or differentiation-inducing conditions. Induced levels of OAS and PKR were determined by RT-PCR. Results are shown as ratios of values for treated and untreated keratinocytes.

References

    1. Anonymous. Imiquimod for genital warts. Med Lett Drugs Ther. 1997;39:118–119. - PubMed
    1. Arany I, Brysk M M, Brysk H, Tyring S K. Response to interferon treatment decreases with epidermal dedifferentiation in condylomas. Antivir Res. 1996;32:19–26. - PubMed
    1. Arany I, Tyring S K. Activation of local cell-mediated immunity in interferon responsive patients with human papillomavirus-associated lesions. J Interferon Cytokine Res. 1996;16:453–460. - PubMed
    1. Arany I, Tyring S K. Status of local cellular immunity in interferon responsive and nonresponsive human papillomavirus-associated lesions. Sex Transm Dis. 1996;26:475–480. - PubMed
    1. Beutner K R, Spruance S L, Hougham A J, Fox T L, Owens M L, Douglas J M., Jr Treatment of genital warts with an immune-response modifier (imiquimod) J Am Acad Dermatol. 1998;38:230–239. - PubMed

Publication types

MeSH terms