

Variation in the oxygen isotope ratio of phloem sap sucrose from castor bean. Evidence in support of the Péclet effect
- PMID: 10859197
- PMCID: PMC59035
- DOI: 10.1104/pp.123.2.671
Variation in the oxygen isotope ratio of phloem sap sucrose from castor bean. Evidence in support of the Péclet effect
Abstract
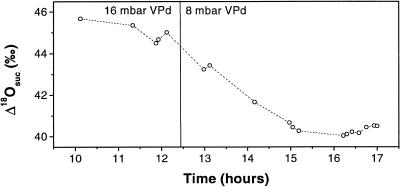
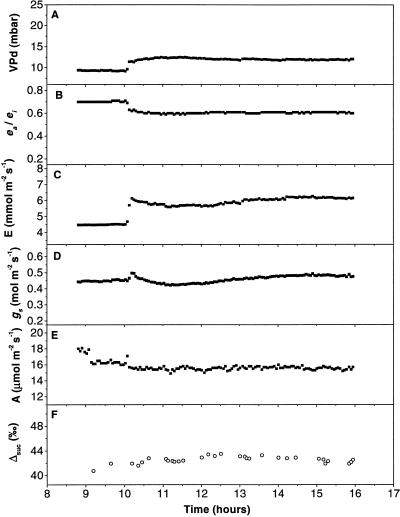
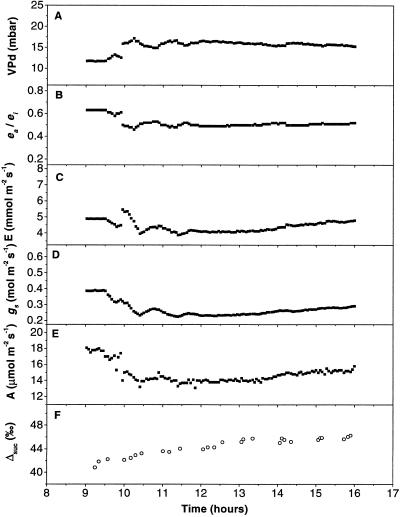
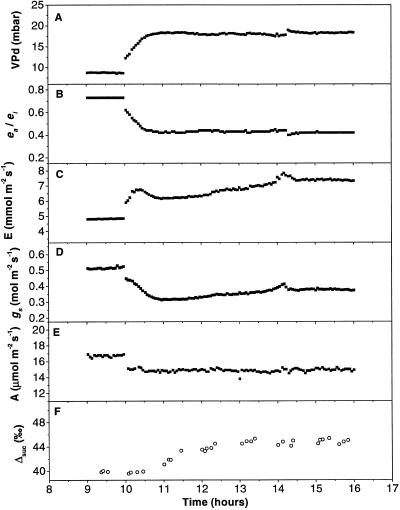
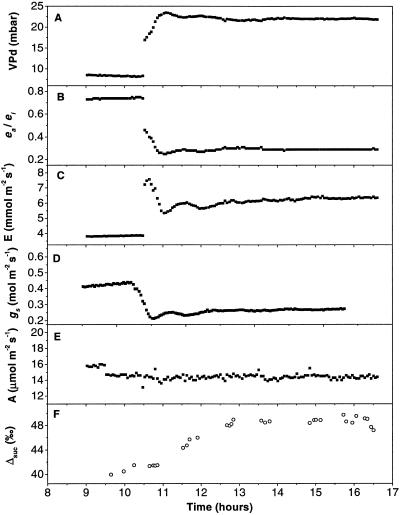
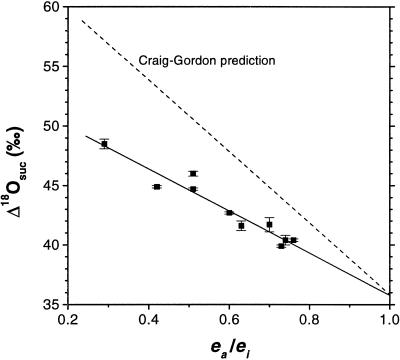
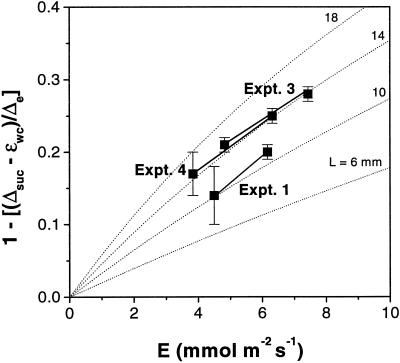
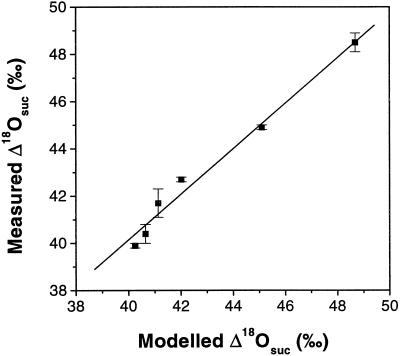
Theory suggests that the level of enrichment of (18)O above source water in plant organic material (Delta) may provide an integrative indicator of control of water loss. However, there are still gaps in our understanding of the processes affecting Delta. One such gap is the observed discrepancy between modeled enrichment of water at the sites of evaporation within the leaf and measured enrichment of the leaf water as a whole (Delta(L)). Farquhar and Lloyd (1993) suggested that this may be caused by a Péclet effect. It is also unclear whether organic material formed in the leaf reflects enrichment of water at the sites of evaporation within the leaf or Delta(L). To investigate this question castor bean (Ricinus communis L.) leaves, still attached to the plant, were sealed into a controlled-environment gas exchange chamber and subjected to a step change in leaf-to-air vapor pressure difference. Sucrose was collected from a cut on the petiole of the leaf in the chamber under equilibrium conditions and every hour for 6 h after the change in leaf-to-air vapor pressure difference. Oxygen isotope composition of sucrose in the phloem sap (Delta(suc)) reflected modeled Delta(L). A model is presented describing Delta(suc) at isotopic steady state, and accounts for 96% of variation in measured Delta(suc). The data strongly support the Péclet effect theory.
Figures
References
-
- Allison GB, Gat JR, Leaney FWJ. The relationship between deuterium and oxygen-18 Δ-values in leaf water. Chem Geol (Isot Geosci Sect) 1985;58:145–156.
-
- Aucour A-M, Hillaire-Marcel C, Bonnefille R. Oxy-gen isotopes in cellulose from modern and quaternary intertropical peatbogs: implications for palaeohydrology. Chem Geol. 1996;129:341–359.
-
- Barbour MM, Farquhar GD (2000) Relative humidity- and ABA-induced variation in carbon and oxygen isotope ratios of cotton leaves. Plant Cell Environ (in press)
-
- Barbour MM, Fischer RA, Sayre KD, Farquhar GD (2000) Oxygen isotope ratio of leaf and grain material correlates with stomatal conductance and grain yield in irrigated wheat. Aust J Plant Physiol (in press)
-
- Bariac T, Rambul S, Jusserand C, Berger A. Evaluating water fluxes of field-grown alfalfa from diurnal observations of natural isotope concentrations, energy budget and ecophysiological parameters. Agric For Meteorol. 1989;48:263–283.
Publication types
MeSH terms
Substances
LinkOut - more resources
Full Text Sources
Miscellaneous
