. 2000 Jun 19;191(12):2121-30.
doi: 10.1084/jem.191.12.2121.

Fibroblasts as host cells in latent leishmaniosis

Affiliations

Fibroblasts as host cells in latent leishmaniosis

C Bogdan et al. J Exp Med. .

Abstract

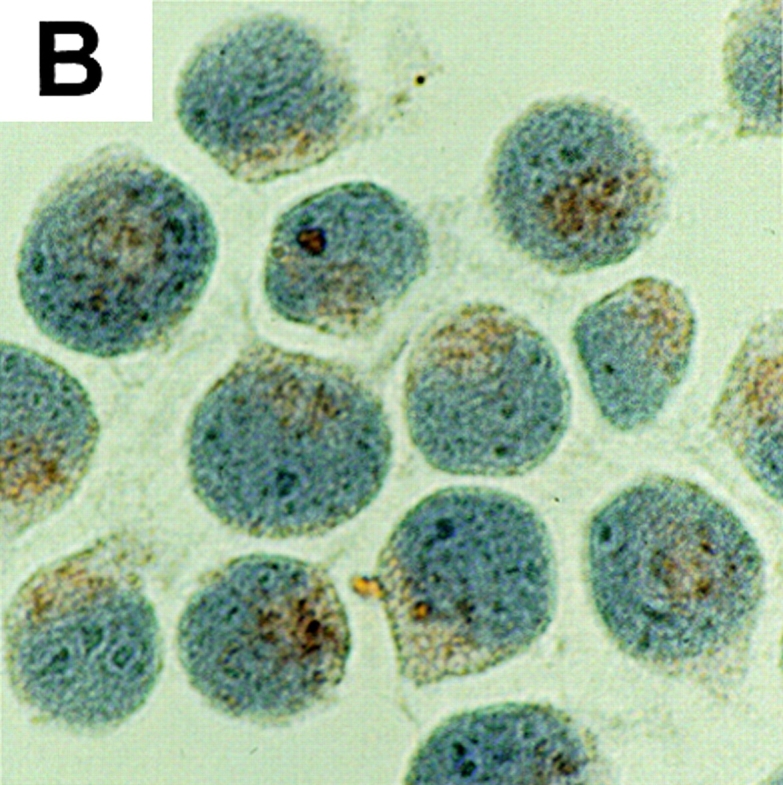
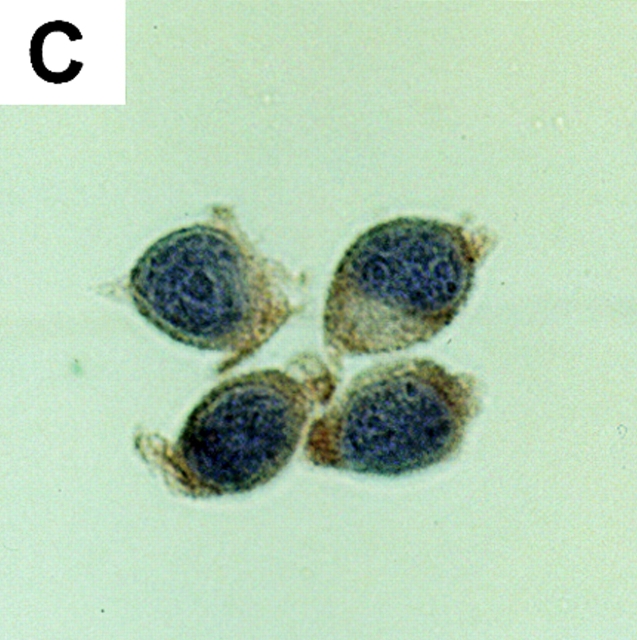
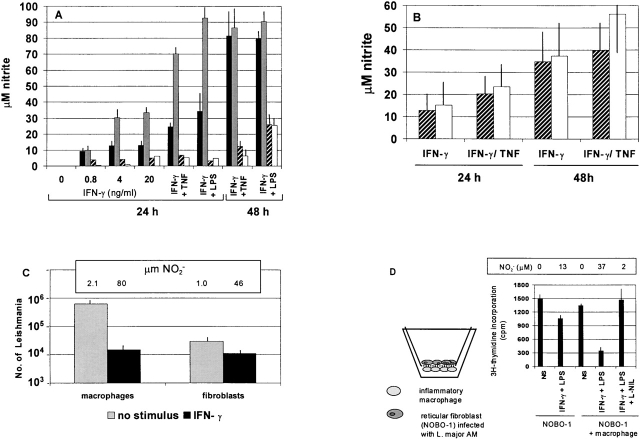
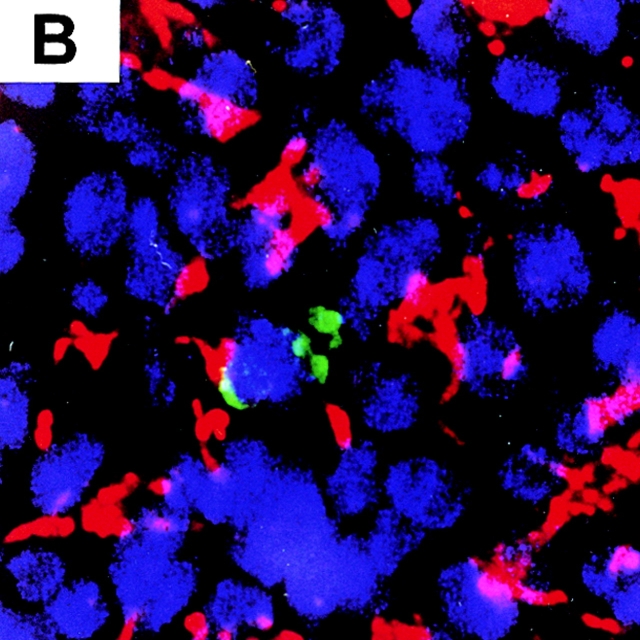
Intracellular parasites are known to persist lifelong in mammalian hosts after the clinical cure of the disease, but the mechanisms of persistence are poorly understood. Here, we show by confocal laser microscopy that in the draining lymph nodes of mice that had healed a cutaneous infection with Leishmania major, 40% of the persisting parasites were associated with fibroblasts forming the reticular meshwork of the lymph nodes. In vitro, both promastigotes and amastigotes of L. major infected primary skin or lymph node fibroblasts. Compared with macrophages, cytokine-activated fibroblasts had a reduced ability to express type 2 nitric oxide synthase and to kill intracellular L. major. These data identify fibroblasts as an important host cell for Leishmania during the chronic phase of infection and suggest that they might serve as safe targets for the parasites in clinically latent disease.


Figures

Figure 1
Figure 1
Expression of fibroblast markers by NOBO-1 cells (reticular fibroblasts isolated from the lymph node of a C57BL/6 mouse at day 239 of infection with L. major; A–D), RPMs (E–H), or thioglycollate-elicited macrophages (J–M). The cells were kept in cultures for 4–6 d and then analyzed for the expression of fibulin-2 (A, E, and J), perlecan (B, F, and K), or ER-TR7 (C, G, and L) by immunoperoxidase staining and hematoxylin counterstaining. Results similar to those shown for NOBO-1 cells were also obtained with primary skin fibroblasts of C57BL/6 mice (not shown). For control purposes, the primary antibodies were omitted and the cells were incubated with the biotinylated secondary reagent alone followed by streptavidin-peroxidase (D, H, and M). Original magnifications: ×1,000.
Figure 1
Figure 1
Expression of fibroblast markers by NOBO-1 cells (reticular fibroblasts isolated from the lymph node of a C57BL/6 mouse at day 239 of infection with L. major; A–D), RPMs (E–H), or thioglycollate-elicited macrophages (J–M). The cells were kept in cultures for 4–6 d and then analyzed for the expression of fibulin-2 (A, E, and J), perlecan (B, F, and K), or ER-TR7 (C, G, and L) by immunoperoxidase staining and hematoxylin counterstaining. Results similar to those shown for NOBO-1 cells were also obtained with primary skin fibroblasts of C57BL/6 mice (not shown). For control purposes, the primary antibodies were omitted and the cells were incubated with the biotinylated secondary reagent alone followed by streptavidin-peroxidase (D, H, and M). Original magnifications: ×1,000.
Figure 2
Figure 2
Uptake of L. major pro- or amastigotes by skin fibroblasts (NOSS-1, CHF-1) or reticular lymph node fibroblasts (NOBO-1) of C57BL/6 mice. (A–C) Immunoperoxidase staining of intracellular parasites, original magnifications ×1,000: (A) NOSS-1 fibroblasts, 24 h after infection with amastigotes; (B) CHF-1 cells, 48 h after infection with amastigotes; (C) NOBO-1 cells, 24 h after infection with promastigotes. (D and E) Detection of intracellular L. major by transmission electron microscopy: (D) NOBO-1 cells, 20 h after infection with amastigotes. Bar, 2.1 μM. (E) NOBO-1 cells, 24 h after infection with promastigotes. Bar, 2.1 μM.
Figure 2
Figure 2
Uptake of L. major pro- or amastigotes by skin fibroblasts (NOSS-1, CHF-1) or reticular lymph node fibroblasts (NOBO-1) of C57BL/6 mice. (A–C) Immunoperoxidase staining of intracellular parasites, original magnifications ×1,000: (A) NOSS-1 fibroblasts, 24 h after infection with amastigotes; (B) CHF-1 cells, 48 h after infection with amastigotes; (C) NOBO-1 cells, 24 h after infection with promastigotes. (D and E) Detection of intracellular L. major by transmission electron microscopy: (D) NOBO-1 cells, 20 h after infection with amastigotes. Bar, 2.1 μM. (E) NOBO-1 cells, 24 h after infection with promastigotes. Bar, 2.1 μM.
Figure 3
Figure 3
NO production and killing of intracellular L. major by RPMs, PEMs, skin fibroblasts (CHF-1), and reticular lymph node fibroblasts (NOBO-1). (A) Nitrite accumulation at 24 or 48 h of stimulation with IFN-γ, IFN-γ (20 ng/ml) plus TNF (10 ng/ml), or IFN-γ (20 ng/ml) plus LPS (20 ng/ml) by equal numbers of uninfected macrophages (RPMs, black bars; PEMs, gray bars) or fibroblasts (CHF-1, hatched bars; NOBO-1, white bars) (mean ± SEM of three to six experiments). (B) Nitrite accumulation in CHF-1 (hatched bars) and NOBO-1 (white bars) fibroblast cultures infected with L. major parasites and stimulated with IFN-γ or IFN-γ plus TNF (20 ng/ml each) (mean ± SD of 7–16 experiments). (C) Killing of intracellular Leishmania by PEMs and CHF-1 infected with a fourfold excess of amastigotes (6-h pulse infection) and cultured with or without IFN-γ (20 ng/ml) for 54 h. The total numbers of cell-associated parasites were determined by limiting dilution analysis (one of four experiments). (D) Killing of L. major amastigotes by NOBO-1 fibroblasts cultured in the absence or presence of PEMs and stimulated with IFN-γ/LPS (20 ng/ml each) with or without L-N 6-iminoethyl-lysine (L-NIL; 1 mM) for 72 h as determined by [3H]thymidine incorporation into Leishmania recovered from host cells after SDS lysis (one of two experiments).
Figure 4
Figure 4
Association of L. major parasites with fibroblasts in popliteal lymph nodes of C57BL/6 mice during the chronic (latent) phase of infection (A, day 206; B–D and F, day 530; E, day 452). (A) L. major amastigote (alkaline phosphate staining, blue) tightly associated with the ER-TR7 fibroblast marker (immunoperoxidase staining, brown; original magnification: ×1,000). (B–F) Triple immunofluorescence overlay images obtained by confocal laser microscopy (acquired with a 40× objective lens, zoom factor 1.0–1.74). (B) Three L. major parasites (DTAF, green) in a ER-TR7–positive cell (nucleus, blue [TOTO-3]; ER-TR7 marker, red [LRSC]). The left of these Leishmania directly colocalizes with the ER-TR7 marker. A fourth parasite on the right is presumably located in a neighboring cell. (C) Seven to eight L. major parasites (DTAF, green; arrow) that colocalize with ER-TR7 (LRSC, red) and therefore appear yellow, but are clearly outside an NOS2-positive area on the bottom of the image that is stained with Cy5 (blue) and appears purple due to colocalization with ER-TR7. (D) Nine L. major parasites (DTAF, green) colocalizing with ER-TR7 (LRSC, red) and NOS-2 (Cy5, blue), therefore appearing white. (E) L. major parasites (DTAF, green) colocalizing with a Mac-1–positive cell (Cy5, blue, arrow; two intracellular turquoise parasites) or with matrix (laminin/perlecan-III, LRSC, red; one yellow parasite [arrowhead]). (F) Cluster of 10 L. major parasites (DTAF, green) located in a (presumably) necrotic area of the lymph node largely devoid of nuclei (TOTO-3, blue) and fibroblasts (ER-TR7, LRSC, red).
Figure 4
Figure 4
Association of L. major parasites with fibroblasts in popliteal lymph nodes of C57BL/6 mice during the chronic (latent) phase of infection (A, day 206; B–D and F, day 530; E, day 452). (A) L. major amastigote (alkaline phosphate staining, blue) tightly associated with the ER-TR7 fibroblast marker (immunoperoxidase staining, brown; original magnification: ×1,000). (B–F) Triple immunofluorescence overlay images obtained by confocal laser microscopy (acquired with a 40× objective lens, zoom factor 1.0–1.74). (B) Three L. major parasites (DTAF, green) in a ER-TR7–positive cell (nucleus, blue [TOTO-3]; ER-TR7 marker, red [LRSC]). The left of these Leishmania directly colocalizes with the ER-TR7 marker. A fourth parasite on the right is presumably located in a neighboring cell. (C) Seven to eight L. major parasites (DTAF, green; arrow) that colocalize with ER-TR7 (LRSC, red) and therefore appear yellow, but are clearly outside an NOS2-positive area on the bottom of the image that is stained with Cy5 (blue) and appears purple due to colocalization with ER-TR7. (D) Nine L. major parasites (DTAF, green) colocalizing with ER-TR7 (LRSC, red) and NOS-2 (Cy5, blue), therefore appearing white. (E) L. major parasites (DTAF, green) colocalizing with a Mac-1–positive cell (Cy5, blue, arrow; two intracellular turquoise parasites) or with matrix (laminin/perlecan-III, LRSC, red; one yellow parasite [arrowhead]). (F) Cluster of 10 L. major parasites (DTAF, green) located in a (presumably) necrotic area of the lymph node largely devoid of nuclei (TOTO-3, blue) and fibroblasts (ER-TR7, LRSC, red).

References

    1. Murray P.J. Defining the requirements for immunological control of mycobacterial infections. Trends Microbiol. 1999;7:366–372. - PubMed
    1. Bogdan C., Röllinghoff M. How do protozoan parasites survive inside macrophages? Parasitol. Today. 1999;15:22–28. - PubMed
    1. Titus R.G., Theodos C.M., Shankar A., Hall L.R. Interactions between Leishmania major and macrophages. In: Zwilling T., Eisenstein T., editors. Macrophage–Pathogen Interactions. Marcel Dekker, Inc; New York: 1993. pp. 437–459. - PubMed
    1. Pearson R.D., de Queiroz Sousa A. Clinical spectrum of leishmaniasis. Clin. Infect. Dis. 1996;22:1–13. - PubMed
    1. Reiner S.L., Locksley R.M. The regulation of immunity to Leishmania major . Annu. Rev. Immunol. 1995;13:151–177. - PubMed

Publication types