

The evolution of RNA viruses: A population genetics view
- PMID: 10860958
- PMCID: PMC34371
- DOI: 10.1073/pnas.97.13.6967
The evolution of RNA viruses: A population genetics view
Abstract
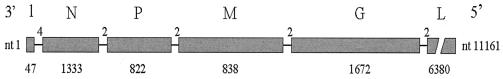
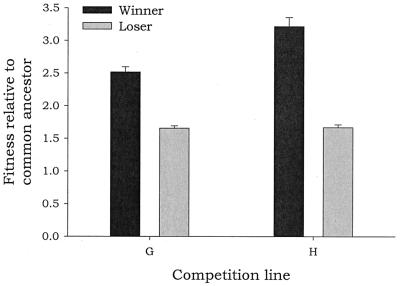
RNA viruses are excellent experimental models for studying evolution under the theoretical framework of population genetics. For a proper justification of this thesis we have introduced some properties of RNA viruses that are relevant for studying evolution. On the other hand, population genetics is a reductionistic theory of evolution. It does not consider or make simplistic assumptions on the transformation laws within and between genotypic and phenotypic spaces. However, such laws are minimized in the case of RNA viruses because the phenotypic space maps onto the genotypic space in a much more linear way than on higher DNA-based organisms. Under experimental conditions, we have tested the role of deleterious and beneficial mutations in the degree of adaptation of vesicular stomatitis virus (VSV), a nonsegmented virus of negative strand. We also have studied how effective population size, initial genetic variability in populations, and environmental heterogeneity shapes the impact of mutations in the evolution of vesicular stomatitis virus. Finally, in an integrative attempt, we discuss pros and cons of the quasispecies theory compared with classic population genetics models for haploid organisms to explain the evolution of RNA viruses.
Figures
References
Publication types
MeSH terms
LinkOut - more resources
Full Text Sources
Miscellaneous
