. 2000 Jun 20;97(13):7521-6.
doi: 10.1073/pnas.97.13.7521.

AML1/ETO-expressing nonleukemic stem cells in acute myelogenous leukemia with 8;21 chromosomal translocation

Affiliations

AML1/ETO-expressing nonleukemic stem cells in acute myelogenous leukemia with 8;21 chromosomal translocation

T Miyamoto et al. Proc Natl Acad Sci U S A. .

Abstract

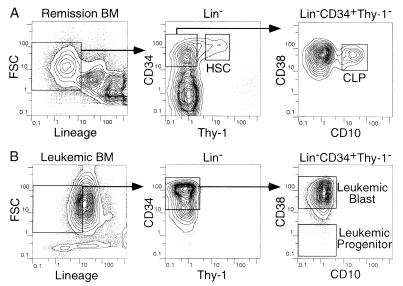
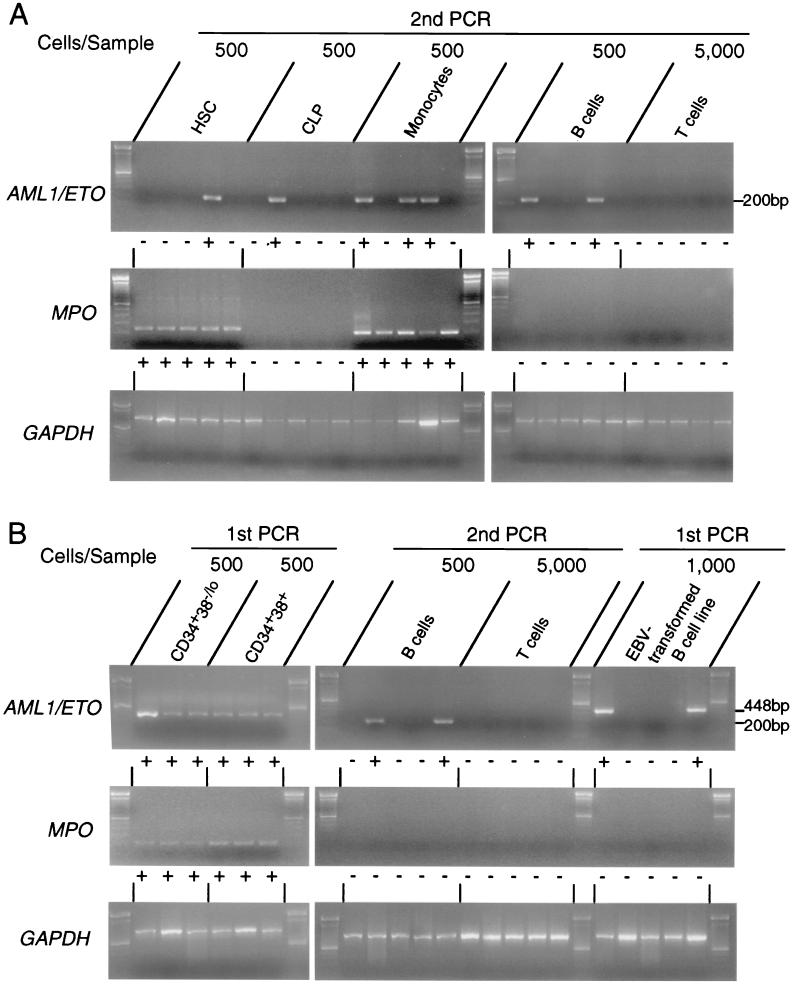
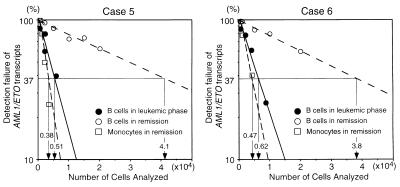
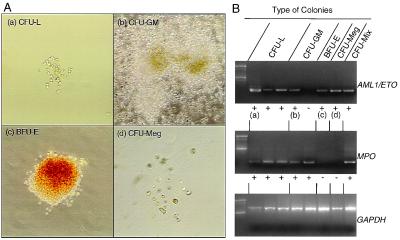
Leukemia-specific AML1/ETO transcripts are detectable in most patients with t(8;21) acute myelogenous leukemia (AML) in long-term remission. To understand the inconsistency between the clinical cure and the presence of "residual disease" at a molecular level, we separated and identified the cells expressing AML1/ETO by phenotype and function. Here we demonstrate that AML1/ETO transcripts are present in a fraction of stem cells, monocytes, and B cells in remission marrow, and in a fraction of B cells in leukemic marrow, but not in T cells. AML1/ETO transcripts also were demonstrated in a fraction of colony-forming cells of erythroid, granulocyte-macrophage, and/or megakaryocyte lineages in both leukemic and remission marrow. These data strongly suggest that the acquisition of the t(8;21) occurs at the level of stem cells capable of differentiating into B cells as well as all myeloid lineages, and that a fraction of the AML1/ETO-expressing stem cells undergo additional oncogenic event(s) that ultimately leads to transformation into AML.


Figures

Figure 1
Figure 1
HSC and CLP in remission and leukemic BM. Five-color flow cytometric analyses of BM cells in remission (A: case 5b) and in leukemic phase (B: case 5a). BM cells were first gated by the negative expression of lineage-related antigens. (A) The CD34+Thy-1+CD38-/lo HSC and CD34+Thy-1-CD10+CD38+ CLP were sorted from remission BM. (B) In leukemic BM, HSC and CLP were absent, whereas primitive CD34+CD38-/lo leukemic progenitors and CD34+CD38+ leukemic blasts existed. FSC, forward light scatter.
Figure 2
Figure 2
Detection of AML1/ETO+ cells in triple-sorted populations from remission or leukemic BM. (A) RT-PCR analysis on purified cells from remission BM. Five hundred HSC, CLP, monocytes, and B cells and 5,000 T cells were triple-sorted and subjected to RT-PCR analysis. Representative data in case 22, who had maintained remission for 80 months at the time of sampling, are shown. The AML1/ETO transcript was sometimes detectable in HSC, CLP, monocytes, and B cells, but not in T cells after the second round of PCR amplification; + and − under each lane depict positive and negative result of PCR, respectively. Data of all cases are summarized in Table 2. Note that MPO gene is not expressed in AML1/ETO+ pooled B cells and CLP, which confirms that the samples do not contain myelomonocytic cells. (B) RT-PCR analysis on purified cells from leukemic BM. Representative data in case 5a are shown. All 500 pooled CD34+CD38-/lo and CD34+CD38+ cells expressed AML1/ETO mRNA, which is detectable by the first round of PCR, and AML1/ETO+ B cells were found at a higher frequency compared with those in remission BM as summarized in Table 3. The last five right lanes show results of PCR analysis in two AML1/ETO+ and three AML1/ETO- EBV-transformed B cell lines established from case 1. Note that in these AML1/ETO+ B cell lines, AML1/ETO transcripts were detectable by the first round of PCR amplification. GAPDH, glyceraldehyde-3-phosphate dehydrogenase.
Figure 3
Figure 3
Frequency of AML1/ETO+ cells in B cells and monocytes estimated by limit dilution analyses. The percent of samples negative by RT-PCR for AML1/ETO transcripts is plotted on the y axis versus the number of cells per sample tested. According to the Poisson statistics, the frequency of AML1/ETO+ cells can be estimated as numbers of cells in samples that show 37% of detection failures (arrows). The frequency of AML1/ETO+ cells was estimated to be 1 in 41,000 (case 5) and 38,000 (case 6) mature B cells in remission marrow (○), and 1 in 5,100 (case 5) and 6,200 (case 6) mature B cells in leukemic marrow (●), indicating that leukemic BM contains t(8;21)+ B cells at ≈10-fold higher frequency, compared with remission BM. AML1/ETO+ cell was estimated to be in 1 in 3,800 (case 5) and 4,700 (case 6) monocytes in remission marrow (□).
Figure 4
Figure 4
AML1/ETO+ myeloid progenitors in the CD34+CD38-/lo fraction of leukemic BM. (A) Morphology of AML1/ETO+ myeloid colonies and AML1/ETO+ leukemic blast colonies derived from single AML1/ETO+ progenitors. These AML1/ETO+ colonies included colonies composed of CFU-L (a), CFU-GM (b), BFU-E (c), and CFU-Meg (d). (B) RT-PCR analysis of cells picked from single cell-derived colonies. ad correspond to ad in A. Note that erythrocyte and megakaryocyte colonies did not express MPO gene, which confirms that these colonies did not contain myelomonocytic components. The frequency of these AML1/ETO+ myeloid progenitors was up to 60% in total myeloid colonies as shown in Table 4. GAPDH, glyceraldehyde-3-phosphate dehydrogenase.
Figure 5
Figure 5
Gradual decrease in frequency of AML1/ETO+ progenitors along with remission duration. Twenty-one remission marrow samples from 19 patients who had maintained complete remission >5 years after the sampling were analyzed. Fifteen cases were treated with chemotherapy (●) and four cases were treated with autologous MBT (○). The frequency of AML1/ETO+ myeloid progenitors and remission duration at the time of sampling appeared to be inversely correlated by a Spearman rank correlation analysis (P = 0.0006, r = −0.907 in patients treated with chemotherapy; P = 0.2774, r = −0.486 in patients treated with autologous MBT; P = 0.0007, r = −0.751 in total patients). The correlation curve shows the result in patients treated with chemotherapy.

References

    1. Hagemeijer A, Garson O M, Kondo K. Cancer Genet Cytogenet. 1984;11:284–287. - PubMed
    1. Miyoshi H, Shimizu K, Kozu T, Maseki N, Kaneko Y, Ohki M. Proc Natl Acad Sci USA. 1991;88:10431–10434. - PMC - PubMed
    1. Shimizu K, Miyoshi H, Kozu T, Nagata J, Enomoto K, Maseki N, Kaneko Y, Ohki M. Cancer Res. 1992;52:6945–6948. - PubMed
    1. Erickson P, Gao J, Chang K S, Look T, Whisenant E, Raimondi S, Lasher R, Trujillo J, Rowley J, Drabkin H. Blood. 1992;80:1825–1831. - PubMed
    1. Nucifora G, Larson R A, Rowley J D. Blood. 1993;82:712–715. - PubMed

Publication types

MeSH terms