. 2000 Jun 20;97(13):7603-8.
doi: 10.1073/pnas.97.13.7603.

Coupling between changes in human brain temperature and oxidative metabolism during prolonged visual stimulation

Affiliations

Coupling between changes in human brain temperature and oxidative metabolism during prolonged visual stimulation

D A Yablonskiy et al. Proc Natl Acad Sci U S A. .

Erratum in

  • Proc Natl Acad Sci U S A 2000 Aug 15;97(17):9819

Abstract

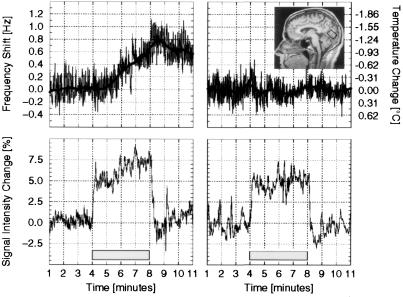
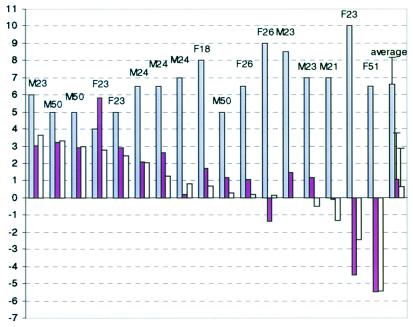
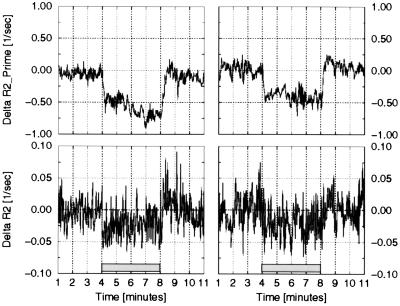
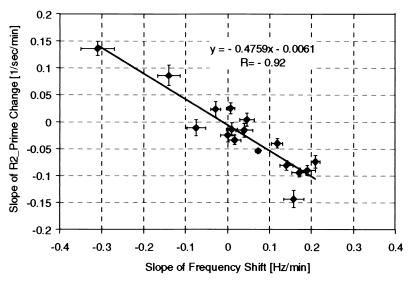
A fundamental discovery of modern human brain imaging with positron-emission tomography that the blood flow to activated regions of the normal human brain increases substantially more than the oxygen consumption has led to a broad discussion in the literature concerning possible mechanisms responsible for this phenomenon. Presently no consensus exists. It is well known that oxygen delivery is not the only function of systemic circulation. Additional roles include delivery of nutrients and other required substances to the tissue, waste removal, and temperature regulation. Among these other functions, the role of regional cerebral blood flow in local brain temperature regulation has received scant attention. Here we present a theoretical analysis supported by empirical data obtained with functional magnetic resonance suggesting that increase in regional cerebral blood flow during functional stimulation can cause local changes in the brain temperature and subsequent local changes in the oxygen metabolism. On average, temperature decreases by 0.2 degrees C, but individual variations up to +/-1 degrees C were also observed. Major factors contributing to temperature regulation during functional stimulation are changes in the oxygen consumption, changes in the temperature of incoming arterial blood, and extensive heat exchange between activated and surrounding brain tissue.


Figures

Figure 1
Figure 1
Two examples of the data representing the change in resonance frequency of the MR signal (Upper) and the change in the BOLD MR signal (Lower) as observed in human primary visual cortex of a single volunteer during visual stimulation. The equivalent change in local brain temperature is plotted as a bold line and noted on the right-hand axis of Upper. (Inset) Midsagittal MRI image of one subject participating in these studies. The rectangle represents voxel positioned over primary visual cortex with the calcarine sulcus running through the middle, parallel to its long axis. The visual stimulation used in this study predictably produces large increases in blood flow in this region. Shaded area indicates the time when functional stimulation was used.
Figure 2
Figure 2
Summary of the results obtained from 17 studies. The first 17 blocks of columns represent results of individual studies. The last block is an average over all 17 studies (error bars represent standard deviation). Letters indicate volunteer's gender and age. First (white) column in each block is an initial BOLD signal—percent of signal intensity change between baseline and initial fast phase of the activation period. Second (yellow) column in each block represents a change in the percent of signal intensity change over the slow phase of the activation period. Third (green) column in each block represents signal frequency change (scaled by a factor of 5) over the slow phase of the activation period. Note that initial BOLD signal is always positive. Also note very high correlation [Δ(ΔS/S)(%) = 5.44⋅Δν(Hz), R = 0.9] between changes in the signal intensity and frequency during the slow phase of activation period.
Figure 3
Figure 3
Two examples of the changes in the R2 and R2′ relaxation rate constants. Results are shown for the same data sets as in Fig. 1. Note that changes in R2 during functional activation, while statistically significant, are order of magnitude smaller than changes in R2′.
Figure 4
Figure 4
Plot of the slope that characterizes the time changes in the R2′ relaxation rate constant vs. the slope that characterizes the time changes of the signal frequency during the slow phase of activation period for all 17 data sets. Error bars represent the accuracy of the linear regression. A very high correlation with the R value of 0.92 is seen in these data. Because changes in the R2′ relaxation rate constant are proportional to the changes in the amount of deoxyhemoglobin and changes in the fMR signal frequency are proportional to the changes in the tissue temperature, the correlation suggests that changes in the brain temperature during functional activation are accompanied by correlated changes in the activated tissue metabolic rate.

References

    1. Swan H. Thermoregulation and Bioenergetics. New York: Elsevier; 1974.
    1. Holdcroft A. Body Temperature Control. London: Baillier Tindall; 1980.
    1. Siesjo B. Brain Energy Metabolism. New York: Wiley; 1978.
    1. Guyton A. Textbook of Medical Physiology. 7th Ed. Philadelphia: Saunders; 1987.
    1. Busto R, Dietrich W D, Globus M Y, Valdes I, Scheinberg P, Ginsberg M D. J Cereb Blood Flow Metab. 1987;7:729–738. - PubMed

Publication types

LinkOut - more resources