. 2000 Jul 1;20(13):4769-75.
doi: 10.1523/JNEUROSCI.20-13-04769.2000.

Alternative splicing in the cytoplasmic II-III loop of the N-type Ca channel alpha 1B subunit: functional differences are beta subunit-specific

Affiliations

Alternative splicing in the cytoplasmic II-III loop of the N-type Ca channel alpha 1B subunit: functional differences are beta subunit-specific

J Q Pan et al. J Neurosci. .

Abstract

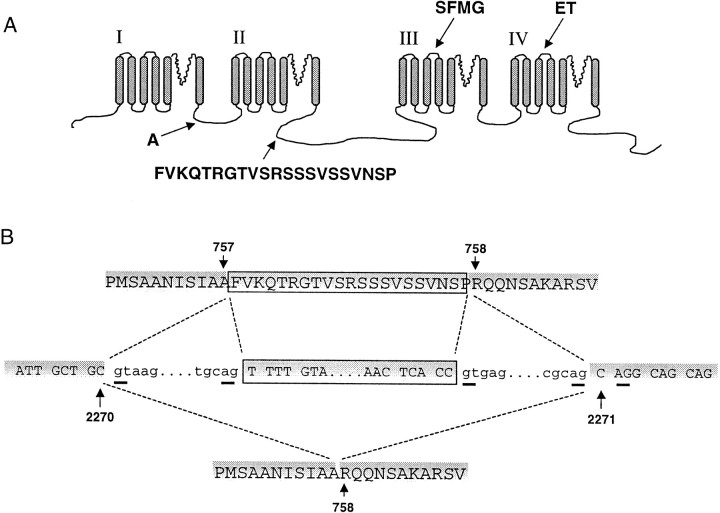
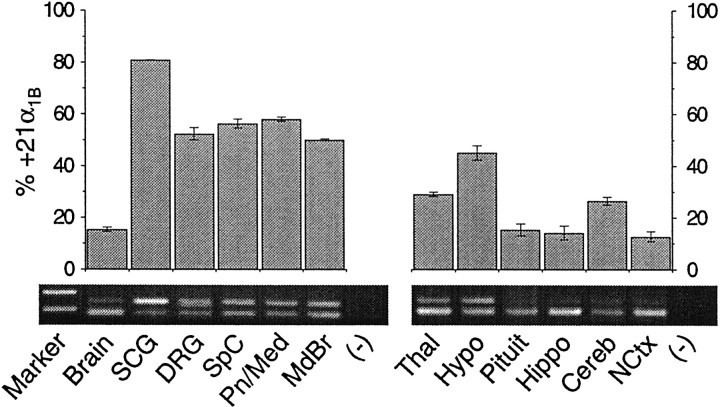
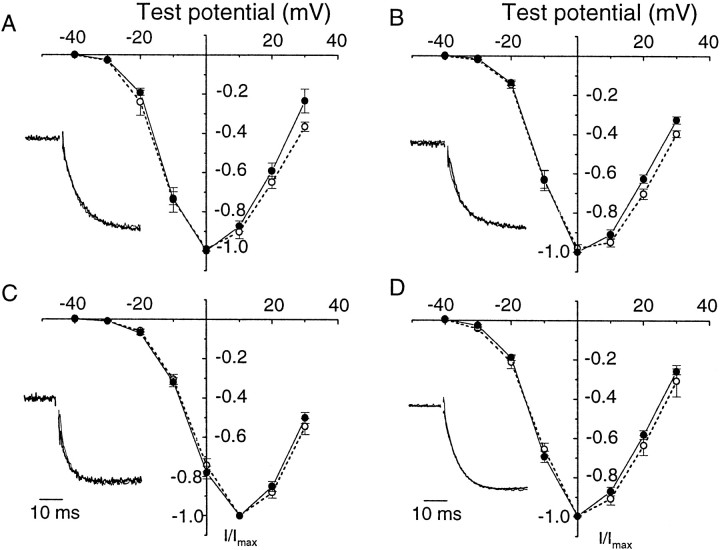
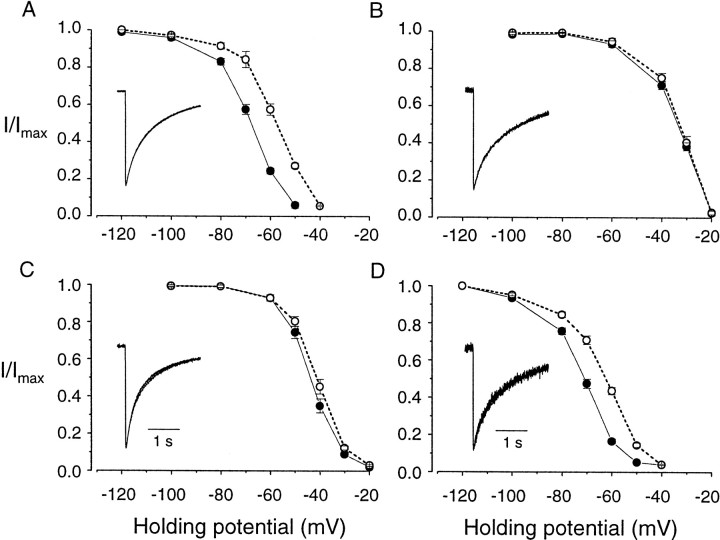
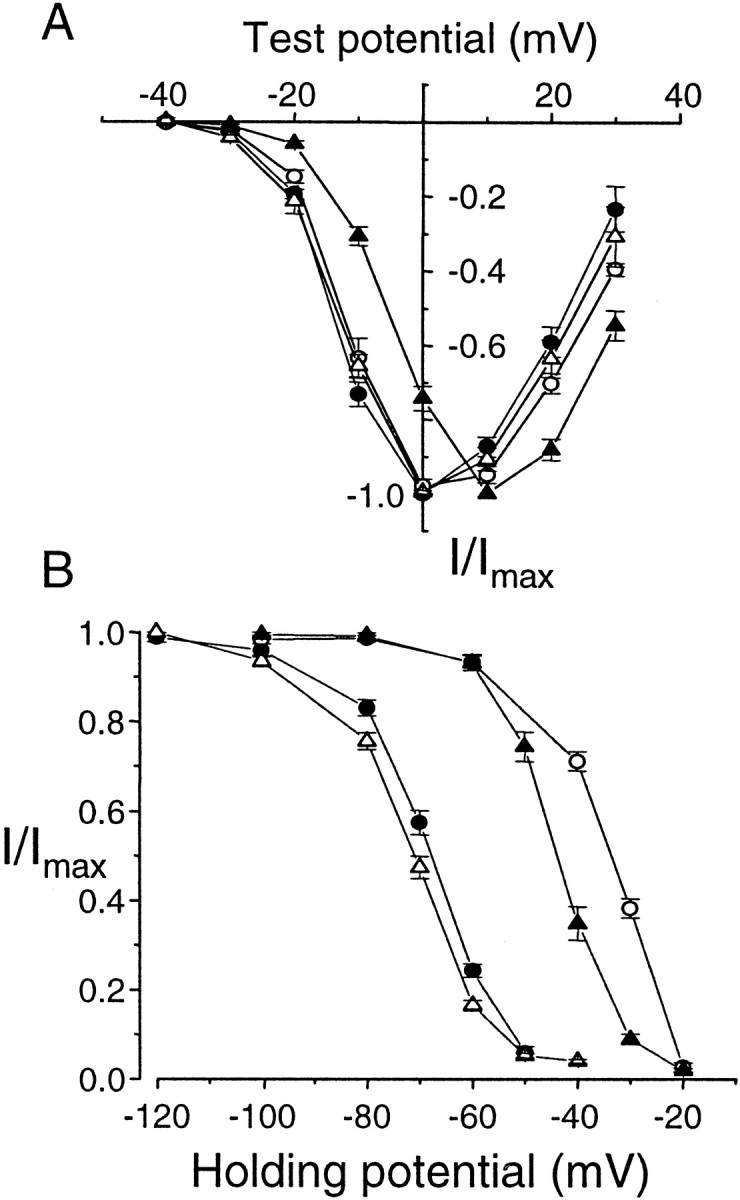
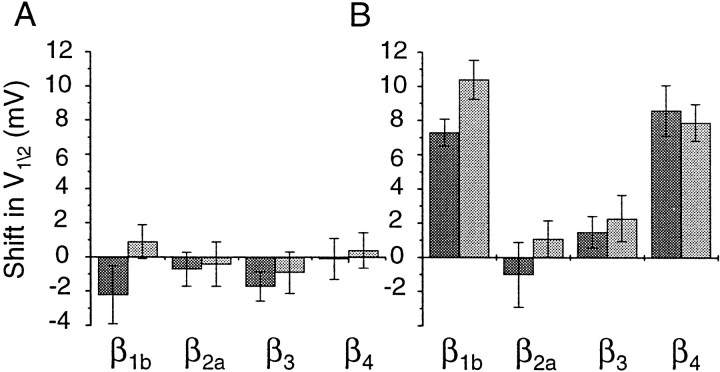
Structural diversity of voltage-gated Ca channels underlies much of the functional diversity in Ca signaling in neurons. Alternative splicing is an important mechanism for generating structural variants within a single gene family. In this paper, we show the expression pattern of an alternatively spliced 21 amino acid encoding exon in the II-III cytoplasmic loop region of the N-type Ca channel alpha(1B) subunit and assess its functional impact. Exon-containing alpha(1B) mRNA dominated in sympathetic ganglia and was present in approximately 50% of alpha(1B) mRNA in spinal cord and caudal regions of the brain and in the minority of alpha(1B) mRNA in neocortex, hippocampus, and cerebellum (<20%). The II-III loop exon affected voltage-dependent inactivation of the N-type Ca channel. Steady-state inactivation curves were shifted to more depolarized potentials without affects on either the rate or voltage dependence of channel opening. Differences in voltage-dependent inactivation between alpha(1B) splice variants were most clearly manifested in the presence of Ca channel beta(1b) or beta(4), rather than beta(2a) or beta(3), subunits. Our results suggest that exon-lacking alpha(1B) splice variants that associate with beta(1b) and beta(4) subunits will be susceptible to voltage-dependent inactivation at voltages in the range of neuronal resting membrane potentials (-60 to -80 mV). In contrast, alpha(1B) splice variants that associate with either beta(2a) or beta(3) subunits will be relatively resistant to inactivation at these voltages. The potential to mix and match multiple alpha(1B) splice variants and beta subunits probably represents a mechanism for controlling the plasticity of excitation-secretion coupling at different synapses.


Figures

Fig. 1.
Fig. 1.
Sites of alternative splicing in the N-type calcium channel α1B subunit. A, Putative membrane topology of the α1B subunit and location of four alternatively spliced sequences encoding Ala415 in intracellular loop I–II (A), 21 amino acids in intracellular loop II–III (FVKQTRGTVSRSSSVSSVNSP), four amino acids in IIIS3–IIIS4 (SFMG), and two amino acids in IVS3–IVS4 (ET). With the exception of Ala415 whose expression depends on the use of alternative 3′ splice–acceptors, expression of the other three sites is regulated by alternative splicing of isolated exon cassettes (Lin et al., 1997, 1999). B, Genomic sequence derived from analysis of the α1B gene in the region of the intracellular II–III loop (middle) together with the amino acid sequences of two cDNAs derived by RT-PCR from rat neurons(top, bottom). The location of exons (uppercase letters, shaded), introns (lowercase), the 63 base exon cassette (boxed), and splice junction consensusag-gt dinucleotide sequences (underlined) are indicated. Nucleotides 2270 and 2271and amino acids A757 (757) and R758 (758) denote the splice junction (numbering according to GenBank sequence M92905) (Dubel et al., 1992).Dashed lines indicate the two patterns of alternative splicing that give rise to +21α1B (top) and Δ21α1B (bottom). The genomic sequence of this region is available under GenBank accession number AF222338.
Fig. 2.
Fig. 2.
Expression pattern of +21α1B and Δ21α1B mRNAs in various regions of the nervous system of the adult rat. Top, Summary of RT-PCR analysis showing the relative abundance of the +21α1B mRNA variant expressed as a fraction of total α1B mRNA derived from brain (Brain), superior cervical ganglia (SCG), dorsal root ganglia (DRG), spinal cord (SpC), pons and medulla (Pn/Med), midbrain (MdBr), thalamus (Thal), hypothalamus (Hypo), pituitary (Pituit), hippocampus (Hippo), cerebellum (Cereb), neocortex (NCtx), and template negative PCR controls (−). Data were averaged from analysis of at least three different RNA samples for each tissue isolated from multiple rats (mean ± SE).Bottom, Example of PCR-derived cDNAs separated by electrophoresis in 2% agarose. Two cDNA products were amplified from each sample (285 and 348 bp) corresponding to Δ21α1Band +21α1B mRNA. The first lane shows 300 and 400 bp size markers. One microliter of RT reaction, except for pituitary (3 μl), was used as template for PCR amplification for all RNA samples. Relative band intensities were estimated using Alpha Inotech gel documentation software and normalized for size differences.
Fig. 3.
Fig. 3.
+21α1B and Δ21α1Bsplice variants have similar voltage- and time-dependent activation properties. Normalized, averaged peak current–voltage plots were calculated from Xenopus oocytes expressing Δ21α1B (●) and +21α1B (○) subunits together with Ca channel β1b (A), β2a (B), β3(C), and β4(D) subunits. Currents were activated by brief depolarizations to various test potentials from a holding potential of −80 mV. Barium (5 mm) was the charge carrier. Normalized, averaged current traces for Δ21α1B (thick line) and +21α1B (thin line) are shown superimposed as insets in A–D. Currents shown were activated by depolarization to −10 mV for β1b, β2a, and β4 and, to compensate for its different voltage-dependent activation, to 0 mV for β3. Activation midpoints for currents induced by the expression were as follows: +21α1B1b, −12.7 ± 0.8 mV (n = 5); +21α1B2a, −12.1 ± 0.7 mV (n = 6); +21α1B3, −5.5 ± 0.7 mV (n = 5); and +21α1B4, −13.2 ± 0.5 mV (n = 7). These values were not significantly different from Δ21α1B (see legend to Fig. 5 for Δ21α1B values).
Fig. 4.
Fig. 4.
+21α1B and Δ21α1Bsplice variants have different steady-state inactivation curves depending on which β subunit is coexpressed. Normalized, averaged steady-state inactivation curves were calculated from currents activated by brief depolarizations to 0 mV from various holding potentials in oocytes expressing Δ21α1B (●) and +21α1B (○) subunits together with Ca channel β1b (A), β2a(B), β3 (C), and β4 (D) subunits. Normalized, averaged currents activated by long depolarizations to +20 mV are also shown for Δ21α1B (thick line) and +21α1B (thin line) to compare inactivation kinetics (insets, A–D). Barium (5 mm) was the charge carrier. Midpoints of steady-state inactivation curves for currents induced by the expression were as follows: +21α1B1b, −58.1 ± 0.8 mV (n = 6); +21α1B2a, −33.0 ± 0.8 mV (n = 5); +21α1B3,=−41.5 ± 0.9 mV (n = 5); and +21α1B4, −63.3 ± 0.8 mV (n = 6). Values for Δ21α1Bcurrents are in the legend to Figure 5.
Fig. 5.
Fig. 5.
Functional differences in α1Bcoexpressed with different Ca channel β subunits. N-type Ca channel currents induced by coexpressing Δ21α1B with β1b(●), β2a (○), β3(▴), and β4 (▵) subunits in Xenopus oocytes. Barium (5 mm) was the charge carrier. A, Currents activated by step depolarizations to various test potentials from a holding potential of −80 mV. Normalized, averaged peak current–voltage plots for each β subunit are shown. Each point is mean ± SE. Activation midpoints were as follows: Δ21α1B1b, −13.6 ± 0.6 mV (n = 6); Δ21α1B2a, −11.7 ± 1.1 mV (n = 6); Δ21α1B3, −4.6 ± 1.0 mV (n = 4); and Δ21α1B4, −13.2 ± 0.5 mV (n = 5). In the presence of β3, currents activated at voltages ∼10 mV more depolarized compared with β1b, β2a, and β4. B, Average, steady-state inactivation curves of Δ21α1Bchannels expressed with different β subunits. Currents were activated by depolarizations to 0 mV from different holding potentials. Peak currents were measured and expressed relative to maximum current (holding potential, −120 to −100 mV). Inactivation midpoints were as follows: Δ21α1B1b, −68.5 ± 0.8 mV (n = 6); Δ21α1B2a, −34.1 ± 0.7 mV (n = 5); Δ21α1B3, −43.8 ± 1.0 mV (n = 5); and Δ21α1B4, −71.2 ± 0.7 mV (n = 6).
Fig. 6.
Fig. 6.
Functional differences between α1Bsplice variants are β subunit-specific. Average shifts in channel activation (A) and steady-state inactivation (B) midpoints between Δ21α1B and +21α1B splice variants in the presence of different Ca channel β subunits. Currents were measured using 2 mm Ca (dark shading) and 5 mm Ba (light shading) as the permeant ions. Midpoints of activation calculated from current–voltage plots using 2 mm Ca were as follows: Δ21α1B1b, −13.9 ± 1.2 mV (n = 7); Δ21α1B2a, −7.9 ± 0.8 mV (n = 6); Δ21α1B3, −5.3 ± 0.6 mV (n = 4); and Δ21α1B4, −14.9 ± 1.1 mV (n = 5); and compared with +21α1B1b, −16.1 ± 1.2 mV (n = 5); +21α1B2a, −8.6 ± 0.6 mV (n = 6); +21α1B3, −7.0 ± 0.6 mV (n = 5); and +21α1B4, −15.0 ± 0.5 mV (n = 5). Midpoints from steady-state inactivation curves using 2 mm Ca as charge carrier were as follows: Δ21α1B1b, −72.1 ± 0.6 mV (n = 6); Δ21α1B2a, −37.0 ± 1.6 mV (n = 5); Δ21α1B3, −41.9 ± 0.6 mV (n = 5); and Δ21α1B4, −72.7 ± 1.3 mV (n = 7); and compared with +21α1B1b, −64.4 ± 0.5 mV (n = 6); +21α1B2a, −38.0 ± 1.0 mV (n = 5); +21α1B3, −40.4 ± 0.7 mV (n = 5); and +21α1B4, −64.1 ± 0.7 mV (n = 5). Values are mean ± SE. See legends to Figures 3-5 for values with 5 mm Ba as charge carrier.

References

    1. Bean BP. Neurotransmitter inhibition of neuronal calcium currents by changes in channel voltage dependence. Nature. 1989;340:153–156. - PubMed
    1. Bezprozvanny I, Scheller RH, Tsien RW. Functional impact of syntaxin on gating of N-type and Q-type calcium channels. Nature. 1995;378:623–626. - PubMed
    1. Bourinet E, Soong TW, Sutton K, Slaymaker S, Mathews E, Monteil A, Zamponi GW, Nargeot J, Snutch TP. Splicing of alpha 1A subunit gene generates phenotypic variants of P- and Q-type calcium channels. Nat Neurosci. 1999;2:407–415. - PubMed
    1. Cahill AL, Hurley JH, Fox AP. Coexpression of cloned α(1B), β(2a), and α(2)/Δ subunits produces non-inactivating calcium currents similar to those found in bovine chromaffin cells. J Neurosci. 2000;20:1685–1693. - PMC - PubMed
    1. Castellano A, Wei X, Birnbaumer L, Perez-Reys E. Cloning and expression of a third calcium channel beta subunit. J Biol Chem. 1993a;268:3450–3455. - PubMed

Publication types

MeSH terms

Substances