. 2000 Jul 1;20(13):5179-89.
doi: 10.1523/JNEUROSCI.20-13-05179.2000.

Changes in functional connectivity in orbitofrontal cortex and basolateral amygdala during learning and reversal training

Affiliations

Changes in functional connectivity in orbitofrontal cortex and basolateral amygdala during learning and reversal training

G Schoenbaum et al. J Neurosci. .

Abstract

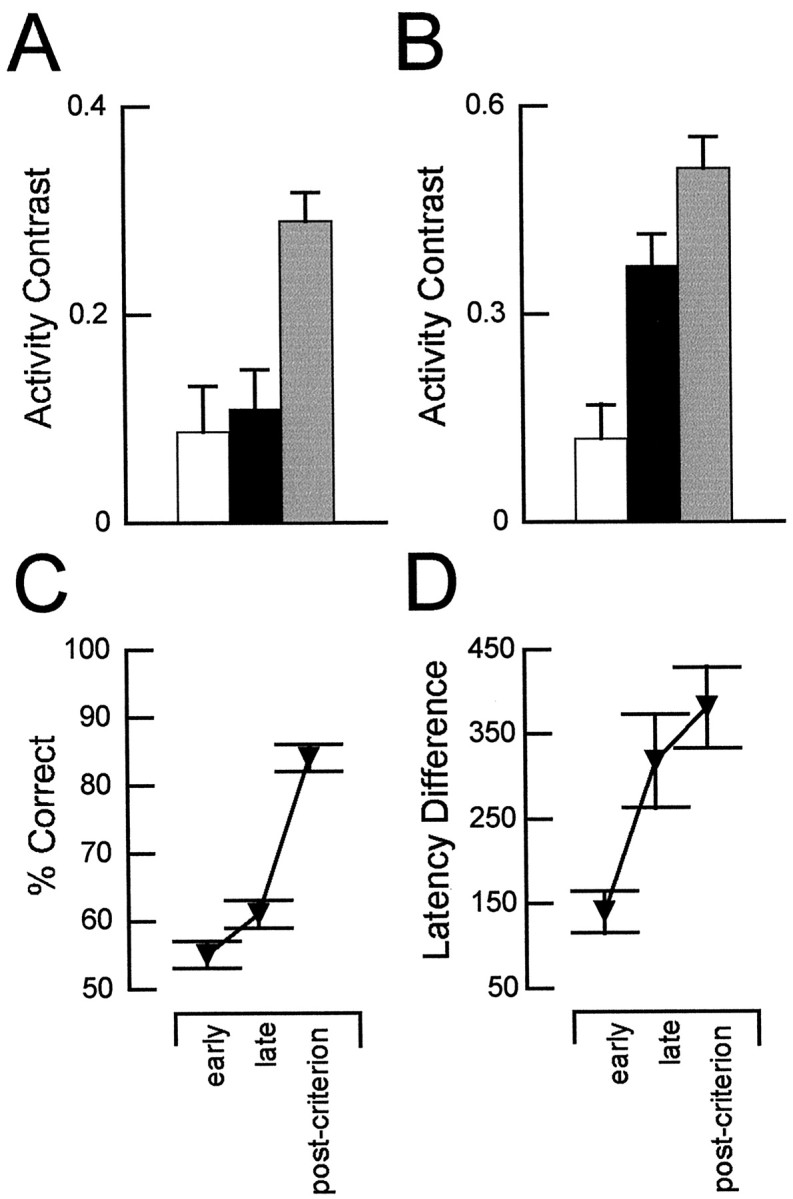
Interconnections between orbitofrontal cortex (OFC) and basolateral amygdala (ABL) are critical for encoding and using associative information about the motivational significance of stimuli. Previously, we reported that neurons in OFC and ABL fired selectively to cues during odor discrimination learning and reversal training. Here we conducted an analysis of correlated firing in the cell pairs recorded in the previous study. Correlated firing during the intertrial intervals was compared across task phases during different phases of acquisition and reversal learning. Changes in correlated activity during initial learning and subsequent accurate performance on the discrimination problems closely resembled the changes in odor selectivity in OFC and ABL reported earlier. Increased correlated firing was most pronounced in OFC during accurate go, no-go performance in the postcriterion phase of performance, whereas correlated firing in ABL increased primarily during an earlier phase of learning. In contrast, findings during subsequent reversal training diverged from our earlier report in which odor selectivity diminished in OFC and reversed in ABL. When the reinforcement contingencies of the odors were reversed after the rat had learned the original associations, correlated firing further increased significantly in OFC but remained stable in ABL. This evidence that associative encoding increments with reversal learning in OFC suggests that the original associations, although not expressed as stimulus driven activity, may be maintained within the network as new associations are acquired.


Figures

Fig. 1.
Fig. 1.
Photograph and schematic drawings illustrating the apparatus and behavior in the odor discrimination task.A, Photograph of the Plexiglas insert removed from the operant chamber showing the odor port and the fluid delivery well. The opening of the odor port was ∼2.5 cm in diameter (white circle). Behind the opening was a hemicylinder into which odors were delivered by a computer-controlled system of solenoids and flow meters. Odors were isolated and precisely controlled to provide an onset latency of <40 msec from activation of the solenoid valve controlling delivery. Air flow from the training chamber and into the odor sampling port was maintained at a rate of at least 0.5 l/min to prevent any diffusion of odors from the port into the chamber. The fluid well consisted of a conical depression (black circle) in a 1-inch-deep (front–back) polycarbonate ledge. The depression could easily hold a 0.05 ml bolus of fluid. Four concealed lines entered a central opening in the bottom of the depression to allow the delivery of the two fluid reinforcers, water to flush the well, and attachment of a vacuum-assisted drain line. Fluid delivery and the vacuum drain were controlled by activation of solenoid valves. Infrared photodetectors mounted in the opening to the odor port and in the blocks on either side of the fluid well signaled behavioral responses. B, Schematic drawings illustrating the sequence of behaviors in the go, no-go olfactory discrimination task. On each trial, the rat had to sample an odor presented to an enclosed hemicylinder behind an odor port (Odor Sampling). Nose-poke into the odor port triggered odor delivery. Based on the identity of that odor, the rat then had to decide whether to respond (Go Response) at a nearby fluid well. A go response resulted in delivery of a rewarding sucrose solution, after presentation of a “positive” odor, or an aversive quinine solution, after presentation of a “negative” odor. Novel odors were presented each day, and the rats began each session by responding rapidly after sampling of each odor. Learning was evident in changes in the rat's latency to respond at the fluid well and also in the shift to an adaptive strategy of only responding on positive trails and of withholding responses on negative trials (No-Go). These two measures of learning emerged at different rates (see Fig. 8). Figure adapted from Schoenbaum et al. (1999).
Fig. 2.
Fig. 2.
Electrode recording sites. Photomicrographs of histological sections showing the reconstruction of recording sites in representative subjects in OFC (A) and ABL (B). In each photomicrograph, a vertical line represents the dorsoventral range along the electrode track from which neurons were recorded in the case shown. To the right of each photomicrograph is a drawing that shows the approximate area in which recordings were obtained in each group. The OFC encompasses the orbital regions and agranular insular cortex. Recordings were localized to ventrolateral and lateral orbital regions (VLO/LO) and ventral agranular insular cortex (AIv) in the four rats in the OFC group. In the ABL group, recordings were localized to the basolateral nucleus in three of the rats (pictured in photomicrograph and as BLAn in drawing) and lateral nucleus in the fourth rat (LAn). Figure adapted from Schoenbaum et al. (1998, 1999), and drawings adapted from Swanson (1992).PIR, piriform cortex; Ald, dorsal agranular insular cortex; int capsule, internal capsule.
Fig. 3.
Fig. 3.
Correlated firing patterns in OFC and ABL. A, Latency of correlated firing in the cell pairs analyzed for OFC and ABL. Cross-correlograms with a bin size of 1 msec were constructed for cell pairs recorded simultaneously in either OFC or ABL using activity during the intertrial interval of postcriterion training. The latency of the response in each cell pair was designated as the bin within 10 msec of time 0 with the highest spike count on the cross-correlogram. The graph (A) reveals a large peak for cell pairs centered at 1–2 msec and an additional smaller peak at 3–5 msec after activity in the reference neuron. B, Cross-correlogram showing correlated firing in a neuron pair exhibiting a short latency interaction; the effectiveness of the interaction above chance is shown in the top right. The short latency interactions appeared to reflect the presence of pairs with restricted peaks close to time 0. C, Cross-correlogram showing correlated firing in a neuron pair exhibiting a longer latency interaction. The longer latency interactions were typically weaker and reflected cell pairs with a more displaced and broader pattern of correlated activity.
Fig. 4.
Fig. 4.
Changes in correlated activity in OFC during intertrial intervals in the early (white bars) and late (black bars) phases of precriterion training, during postcriterion performance (gray bars), and after reversal (striped bars). A, Correlated activity at short latency (within 2 msec of a spike in the reference cell) increased significantly during initial training (F(2,498) = 13.0; p< 0.001). Post hoc comparisons revealed no significant difference between the early and late phases of precriterion training (p = 0.183). However, correlated activity in the postcriterion phase differed significantly from each of the precriterion phases (p < 0.001 andp = 0.003 for early and late, respectively). A separate analysis of neuron pairs recorded during reversals revealed that efficacy of correlated firing within the short latency interval increased further after reversal (F(1,140) = 14.5; p< 0.001). B, Correlated activity at longer latency (2–10 msec after a spike in the reference cell) also increased significantly during initial training (F(2,498) = 90.1; p< 0.001). Efficacy in OFC differed between the early and late precriterion phases (p = 0.0386), and a significant increase in the postcriterion phase was also evident compared with each of the precriterion phases (p < 0.001 for both comparisons). Efficacy of correlated firing within the longer latency interval increased further after reversal (F(1,140) = 58.3; p < 0.001). C, Activity in cell pairs with correlated activity in OFC. Average firing rate is shown for both neurons within each pair that was included in the analyses presented in A and B. Note the difference in both pattern and magnitude between the minimal changes in activity and the changes in correlated firing across the training phases.
Fig. 5.
Fig. 5.
Cross-correlograms for neuron pairs in OFC showing correlated activity within the intertrial intervals during the early and late phases of precriterion training, during postcriterion performance, and after reversal. A, Typical examples of neuron pairs with short latency interactions (0–2 msec).B, Typical examples of neuron pairs with longer latency interactions (2–10 msec). Values are shown in spikes per 1 msec bin, and the horizontal dashed lines on each correlogram designate the upper confidence limit (p < 0.01) for the interactions (see Materials and Methods). Precriterion training is divided into an early and late phase as described in Materials and Methods, and data from reversal training are shown for neuron pairs recorded during reversal sessions. Note that the confidence limit varies somewhat between graphs in some cases, reflecting small changes in firing rate. Although these changes were minimal, they were incorporated into the calculations of efficacy.
Fig. 6.
Fig. 6.
Changes in correlated activity in ABL during intertrial intervals in the early (white bars) and late (black bars) phases of precriterion training, during postcriterion performance (gray bars), and after reversal (striped bars). A, Correlated activity at short latency (within 2 msec of a spike in the reference cell) did not change significantly during training in ABL (F(2,78) = 0.48; p= 0.62). A separate analysis of neuron pairs recorded during reversals also revealed no change in correlated activity at this latency (F(1,19) = 2.31; p= 0.14). B, Changes in correlated activity at longer latency (2–10 msec after a spike in the reference cell) increased significantly during initial training (F(2,78) = 6.29; p= 0.0029). Post hoc comparisons revealed that efficacy increased between the early and late precriterion phases (p = 0.0147) but did not increase in the postcriterion phase relative to the late precriterion phase (p = 0.924). Efficacy of correlated firing within the longer latency interval did not change further after reversal (F(1,19) = 2.3;p = 0.14). C, Activity in cell pairs with correlated activity in ABL. Average firing rate is shown for both neurons within each pair that was included in the analyses presented inA and B. Note the difference in both pattern and magnitude between the minimal changes in activity and the changes in correlated firing across the training phases.
Fig. 7.
Fig. 7.
Cross-correlograms for neuron pairs in ABL showing correlated activity within the intertrial intervals during the early and late phases of precriterion training, during postcriterion performance, and after reversal. A, Examples of neuron pairs with short latency interactions (0–2 msec).B, Example of neuron pair with longer latency interactions (2–10 msec). Values are shown in spikes per 1 msec bin, and the horizontal dashed lines on each correlogram designate the upper confidence limit (p < 0.01) for the interactions (see Materials and Methods). Precriterion training is divided into an early and late phase, and data from reversal training are shown for neuron pairs recorded during reversal sessions. Note that the confidence limit varies somewhat between graphs in some cases, reflecting small changes in firing rate. Although these changes were minimal, they were incorporated into the calculations of efficacy.
Fig. 8.
Fig. 8.
Changes in neural activity during odor sampling and behavioral measures of learning during initial training. Contrast in activity of neurons in OFC (A) and in ABL (B) during odor sampling in the early (white bars) and late (black bars) phases of precriterion training and during postcriterion performance (gray bars). The activity contrast was calculated as the difference in firing rate during sampling of positive and negative odors divided by the sum of those rates, expressed with reference to the preferred odor during postcriterion trials. Activity between trials was used to calculate a baseline contrast of 0.04 for OFC and −0.01 for ABL. ANOVA with post hoc testing showed that selectivity in OFC differed significantly from baseline only during postcriterion training, whereas selectivity in ABL differed in the late and postcriterion phases (*p < 0.05).C, Go, no-go performance in the early and late precriterion and the postcriterion phases (chance, 50%).D, Changes in differential response latency in the early and late precriterion and the postcriterion phases. The latency difference increased significantly (F(2,156) = 6.69; p= 0.0016) from the early to the late phase of precriterion training (*p < 0.05). Latency to respond on positive trials remained near 350 msec across training; thus, the increase was primarily attributable to increases in latency to respond on negative trials. The increase in selectivity in OFC neurons postcriterion (A) coincided with improved accuracy in go, no-go performance (C). Changes in selectivity in ABL neurons (B) coincided more closely with changes in the differential response latency across the training phases (D). A andB were adapted from Schoenbaum et al. (1999).

References

    1. Abeles M. Quantification, smoothing, and confidence limits for single-units' histograms. J Neurosci Methods. 1982;5:317–325. - PubMed
    1. Aertsen AMHJ, Gerstein GL, Habib MK, Palm G. Dynamics of neuronal firing correlation: modulation of “effective connectivity.”. J Neurophysiol. 1989;61:900–917. - PubMed
    1. Baxter MG, Parker A, Lindner CCC, Izquierdo AD, Murray EA (2000) Control of response selection by reinforcer value requires interaction of amygdala and orbital prefrontal cortex. J Neurosci, in press. - PMC - PubMed
    1. Bechara A, Damasio H, Tranel D, Damasio AR. Deciding advantageously before knowing the advantageous strategy. Science. 1997;275:1293–1294. - PubMed
    1. Brody CD. Correlations without synchrony. Neural Comput. 1999;11:1573–1551. - PubMed

Publication types

LinkOut - more resources