Comparative Study
. 2000 Jul 5;97(14):8063-8.
doi: 10.1073/pnas.140209597.

The transcriptional profile of early to middle sporulation in Bacillus subtilis

Affiliations
Comparative Study

The transcriptional profile of early to middle sporulation in Bacillus subtilis

P Fawcett et al. Proc Natl Acad Sci U S A. .

Abstract

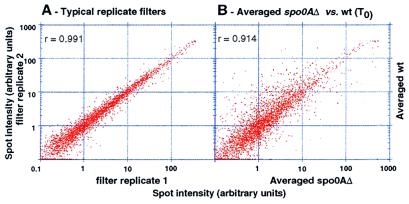
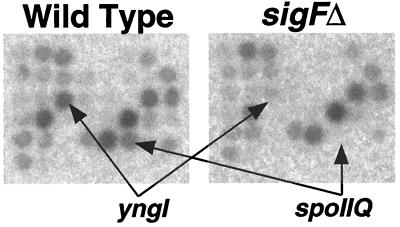
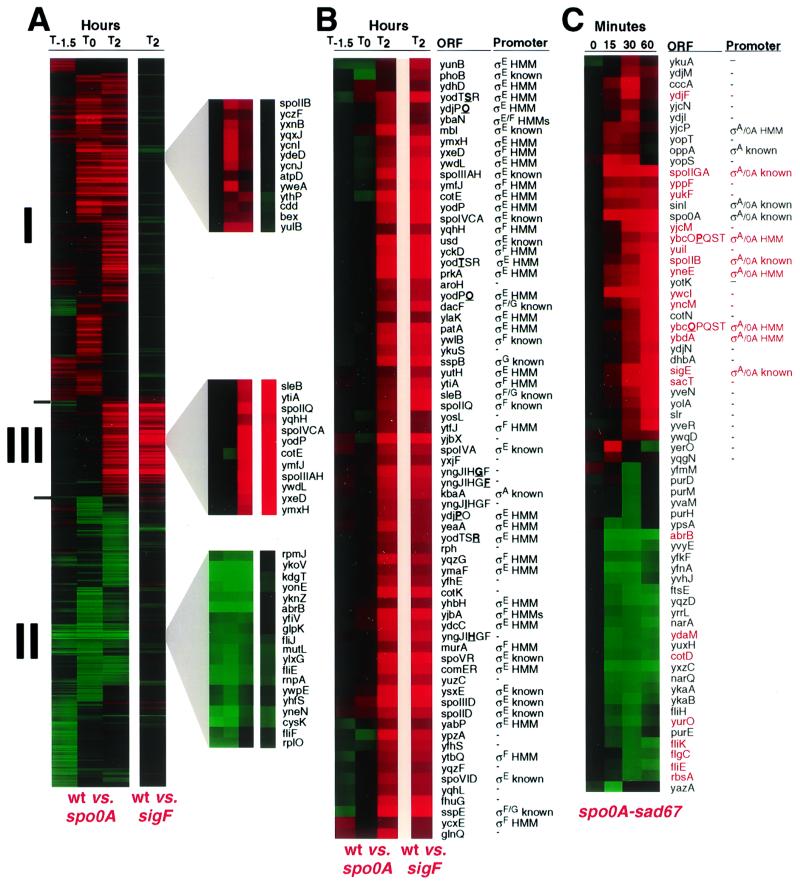
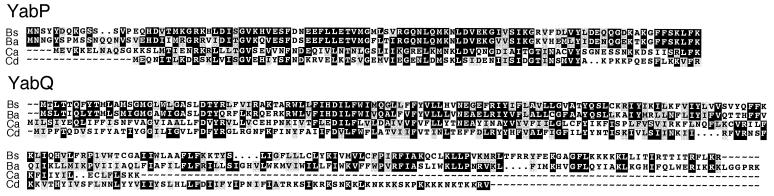
Spore formation by Bacillus subtilis is governed by global changes in gene transcription. We used nylon-substrate DNA arrays representing approximately 96% of the predicted open reading frames in the B. subtilis chromosome to compare the pattern of transcripts from wild-type cells with the pattern from cells mutant for the sporulation transcription factors Spo0A or final sigma(F). We found 520 genes whose transcript levels were at least 3-fold dependent on Spo0A but not on final sigma(F), and an additional 66 genes whose transcript levels were dependent upon both regulatory proteins. Two strategies were used to help assign genes to the direct control of a particular developmental regulatory protein. In one approach, we analyzed the effects on global gene expression of artificially producing a constitutively active form of Spo0A during growth. In a second approach, Hidden Markov models were used to identify promoters likely to be activated by Spo0A, final sigma(F), or a third sporulation transcription factor, final sigma(E). In addition to detecting known sporulation genes, we identified many genes of unknown function whose patterns of expression and regulation suggest that they could be involved in sporulation. Disruption of two such newly identified genes, yabP and yabQ, blocked sporulation at a late stage.


Figures

Figure 1
Figure 1
Logarithmic-scale plots of normalized spot intensities (arbitrary units). (A) Typical replicate filters are shown with the intensity of each spot plotted versus the equivalent spot in a replicate filter. (B) Averaged spot intensities from a filter hybridized with probe from wild-type cells at T0 versus averaged spot intensities from a filter hybridized with probe from the Spo0A mutant at T0. Each graph represents 4,100 individual spots. r is the Pearson correlation coefficient.
Figure 2
Figure 2
Close-ups of autoradiographs of filter arrays probed with cDNA from wild-type (left) and σF (sigF) mutant cells (right) at T2. The arrows point to the known σF-controlled gene spoIIQ and to a gene (yngI) that was not previously known to be under sporulation control.
Figure 3
Figure 3
Eisen plots and HMM predictions. (A) Eisen plot indicating the profiles of 586 genes whose level of expression depended on Spo0A. The genes were ordered so that those with similar expression patterns were grouped together. Columns 1–3 display ratios of normalized spot intensities of hybridization signals for probe from the wild type versus probe for the Spo0A (spo0A) mutant at the indicated times. Column 4 displays the ratio of the hybridization signals for the wild type versus the σF (sigF) mutant at T2. The zoom boxes on the right show representative genes from each of the classes (see text). (B) An annotated Eisen plot is shown for the 66 genes whose expression was higher in the wild type than in both the Spo0A mutant and the σF mutant at T2. When available, known promoters or HMM predictions are indicated. (C) An annotated Eisen plot for the 67 genes that were differentially expressed by 15 or 30 min after the addition of IPTG during vegetative growth to cells of a strain harboring Pspac-spo0A-sad67. The plot compares transcript levels between cells treated with IPTG and untreated cells. Promoters or HMM predictions are indicated for genes induced in response to IPTG. Genes whose expression was dependent on Spo0A but not σF in A and were induced in response to IPTG in this experiment are indicated by the use of red text. Genes that are thought to lie in an operon with other genes in the same expression category are indicated by boldfacing and underlining. Hybridization ratios are displayed colorimetrically, with stronger hybridization for the wild type compared with the mutant shown as shades of red (ratio >1) and stronger hybridization for the mutant (ratio <1) shown as shades of green (A and B). Likewise, red and green indicate higher and lower ratios, respectively, for IPTG-treated cells relative to untreated cells (C).
Figure 4
Figure 4
Inferred amino acid sequences for YabP and YabQ from B. subtilis (Bs) and orthologs (deduced by GeneMark and related algorithms; ref. 33) from B. anthracis (Ba), C. acetobutylicum (Ca), and C. difficile (Cd). B. anthracis, C. acetobutylicum, and C. difficile orthologs were identified in unannotated data from unfinished sequencing projects (http://www.ncbi.nlm.nih.gov/Microb_blast/unfinishedgenome.html).

References

    1. Stragier P, Losick R. Annu Rev Genet. 1996;30:297–241. - PubMed
    1. Chu S, DeRisi J, Eisen M, Mulholland J, Botstein D, Brown P O, Herskowitz I. Science. 1998;282:699–705. - PubMed
    1. Iyer V R, Eisen M B, Ross D T, Schuler G, Moore T, Lee J C F, Trent J M, Staudt L M, Hudson J, Jr, Boguski M S, et al. Science. 1999;283:83–87. - PubMed
    1. Kunst F, Ogasawara N, Moszer I, Albertini A M, Alloni G, Azevedo V, Bertero M G, Bessieres P, Bolotin A, Borchert S, et al. Nature (London) 1997;390:249–256. - PubMed
    1. Burbulys D, Trach K A, Hoch J A. Cell. 1991;64:545–552. - PubMed

Publication types

LinkOut - more resources