Comparative Study
. 2000 Jun;45(6):1611-32.
doi: 10.1088/0031-9155/45/6/315.

Left ventricular motion reconstruction from planar tagged MR images: a comparison

Affiliations
Comparative Study

Left ventricular motion reconstruction from planar tagged MR images: a comparison

J Declerck et al. Phys Med Biol. 2000 Jun.

Abstract

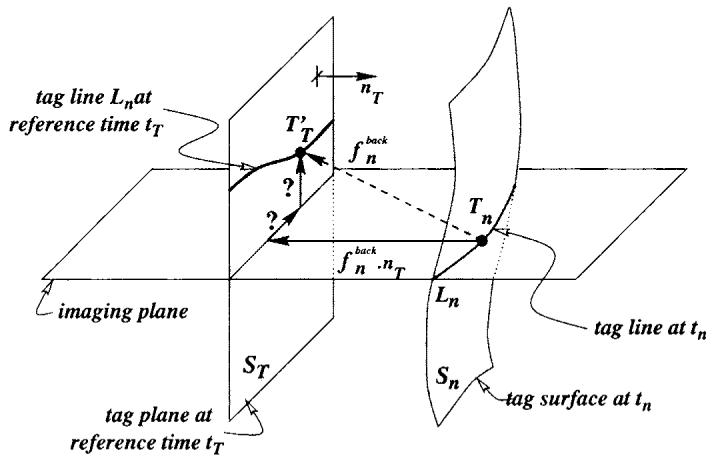
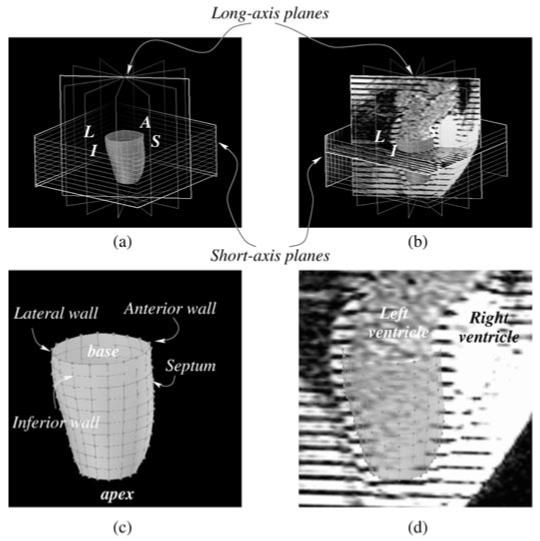
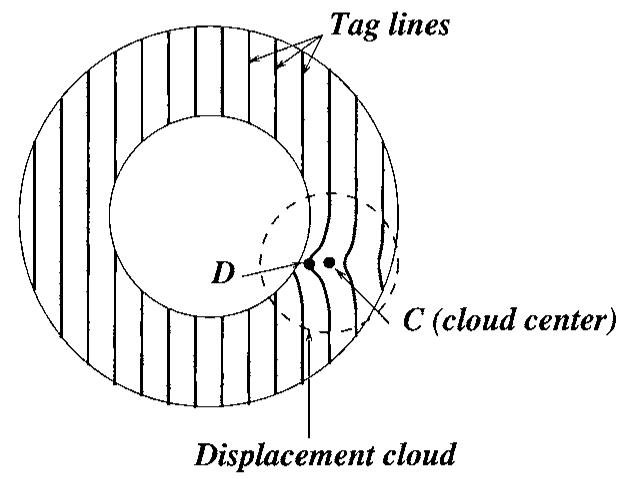
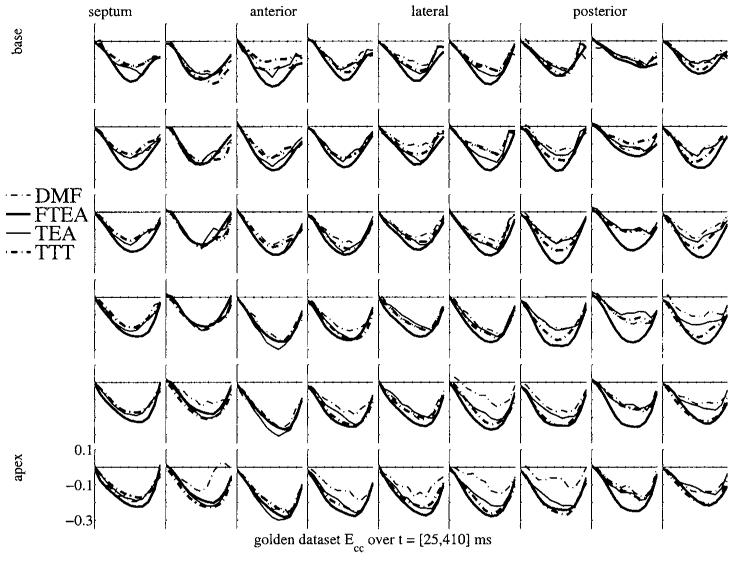
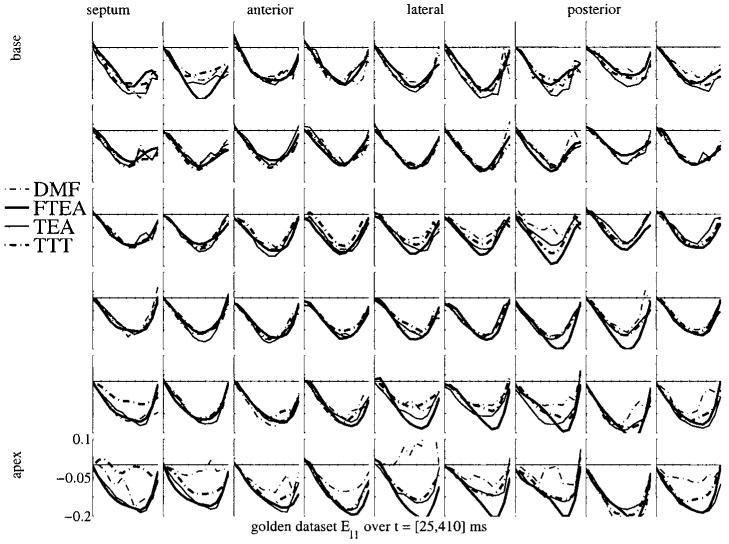
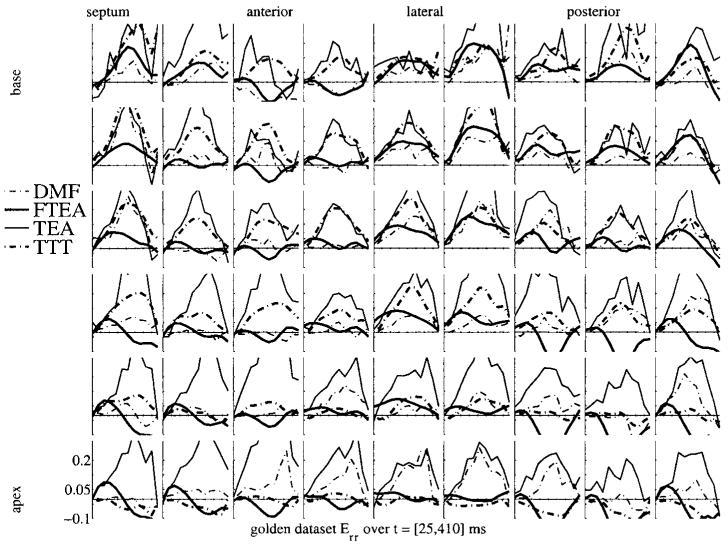
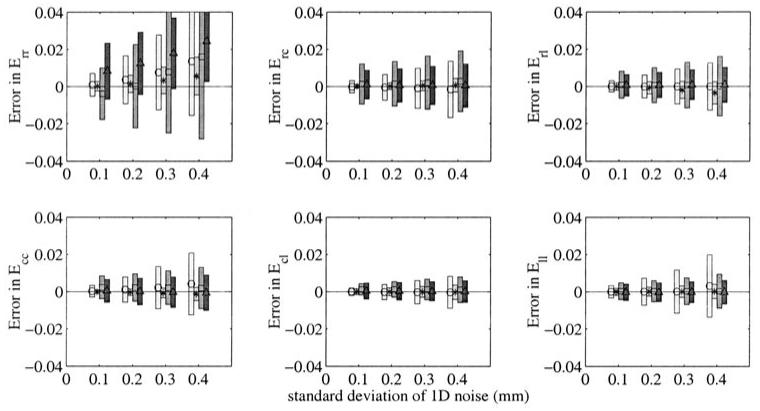
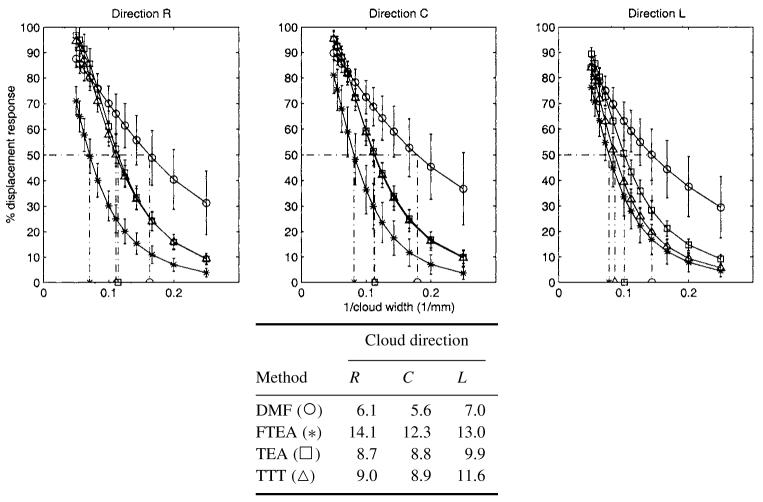
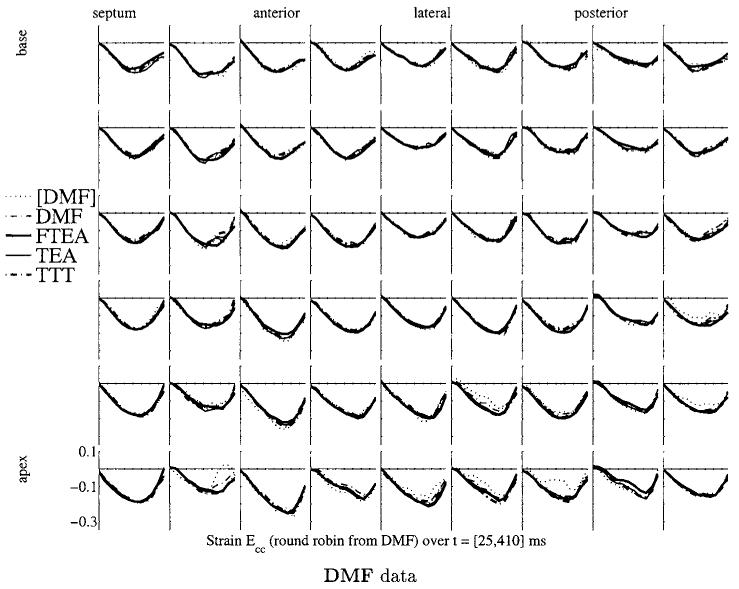
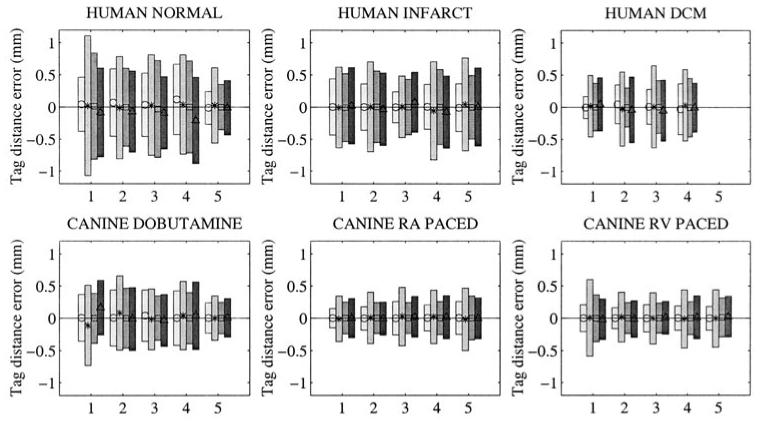
Through recent development of MR techniques, it is now possible to assess regional myocardial wall function in a non-invasive way. Using MR tagging, space is marked with planes which deform with the tissue, providing markers for tracking the local motion of the myocardium. Numerous methods to reconstruct the three-dimensional displacement field have been developed. The aim of this article is to provide a framework to quantitatively compare the performance of four methods the authors have developed. Five sets of experiments are described, and their results are reported. Instructions are also provided to perform similar tests on any method using the same data. The experiments show that some characteristic properties of the methods, such as sensitivity to noise or spatial resolution, can be quantitatively classified. Cross-comparison of performances show what range values for these properties can be considered acceptable.


Figures

Figure 1
Figure 1
The tag plane at tagging time ST deforms into surface Sn at time tn. The backward transformation fnback deforms Sn back onto ST. A tag point Tn of a tag line Ln was a point TT in ST at tagging time tT, which gives a one-dimensional constraint on the displacement. Using three independent tagging directions nT makes the estimation of fnback possible.
Figure 2
Figure 2
(a) The image planes for short- and long-axis data are shown, with the mesh generated for the golden dataset experiment. L stands for lateral wall, I for inferior, S for septum and A for anterior. (b) The same as (a), with some images included. One can see on the long-axis image, the left and right ventricles, the left atrium and the aortic outflow tract. (c) An enlarged view of (a), with anatomical description of each part of the mesh. (d) An enlarged view of (b), with anatomical description on the long-axis image. The mesh is shown in transparency.
Figure 3
Figure 3
The tag points are displaced around the centre of the cloud given a Gaussian roll-off.
Figure 4
Figure 4
Circumferential shortening (Ecc) strain map for the golden dataset for the four methods. Each box shows the strain Ecc as a function of time over systole and early diastole. Thick lines are the 4D methods (FTEA and TTT), thin lines are the 3D methods (DMF and TEA). Broken lines represent the Cartesian methods (DMF and TTT), and full lines represent the ‘polar’ methods (TEA and FTEA).
Figure 5
Figure 5
Ell strain map for the golden dataset for the four methods. The display is similar to that in figure 4.
Figure 6
Figure 6
Err strain map for the golden dataset for the four methods. The display is similar to that in figure 4.
Figure 7
Figure 7
Noise immunity test: for different noise amplitudes, the mean and standard deviation on error on Lagrangian strain E in a local coordinate system (radial, circumferential or longitudinal). The centre of the bar is on the mean value and marked with a sign (○ = DMF, * = FTEA, □ = TEA, △ = TTT), the bar extends up to one standard deviation above and below the mean (from lighter to darker boxes, DMF, FTEA, TEA and TTT).
Figure 8
Figure 8
Spatial resolution for each displacement direction (radial, circumferential or longitudinal): top, for different colud widths, the per cent of displacement response for each method (○ = DMF, * = FTEA, □ = TEA, △ = TTT). Bottom, the corresponding values for response of 50%.
Figure 9
Figure 9
Ecc strain maps for the four methods on the datasets generated for the round robin set of experiments for DMF data. The strain map representation is similar to the one of figure 4.
Figure 10
Figure 10
Pathology database: for different types of motion (human normal, infarcted or dilated cardiomyopathy, canine dobutamine, RA or RV paced), the RMS on error on tag distances. Each set of error bars represents one patient (numbered from 1 to 5). For each patient, four error bars are displayed, one for each method (from lighter to darker boxes, ○ = DMF, * = FTEA, □ = TEA, △ = TTT.

References

    1. Amini A, Curwen R, Constable RT, Gore JC. 1994 MR physics-based snake tracking and dense deformation from tagged cardiac images; AAAI Symposium on Applications of Computer Vision in Medical Image Processing; Stanford, CA, USA. 1994; Mar 21-23, ( http://noodle.med.yale.edu/alums/amini/aaai_tag/aaai_tag.html)
    1. Arts T, Hunter WC, Douglas A, Muijtjens AM, Reneman RS. Description of the deformation of the left ventricle by a kinematic model. J. Biomech. 1992;25:1119–27. - PubMed
    1. Atalar E, McVeigh E. Optimization of tag thickness for measuring position with magnetic resonance imaging. Johns Hopkins University School of Medicine; 1994. Technical Report

    1. Axel L, Dougherty L. MR imaging of motion with spatial modulation of magnetization. Radiology. 1989;171:841–5. - PubMed
    1. Croisille P, Moore CC, Judd RM, Lima JA, Arai M, McVeigh ER, Becker LC, Zerhouni EA. Differentiation of viable and nonviable myocardium by the use of three-dimensional tagged MRI in 2-day-old reperfused canine infarcts. Circulation. 1999;99:284–91. - PubMed

Publication types