. 2000 Jun 26;149(7):1513-26.
doi: 10.1083/jcb.149.7.1513.

Activity-dependent neuronal control of gap-junctional communication in astrocytes

Affiliations

Activity-dependent neuronal control of gap-junctional communication in astrocytes

N Rouach et al. J Cell Biol. .

Abstract

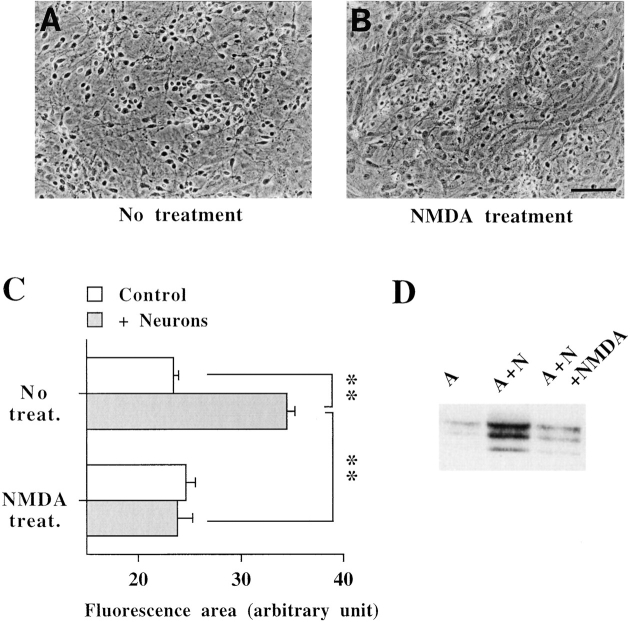
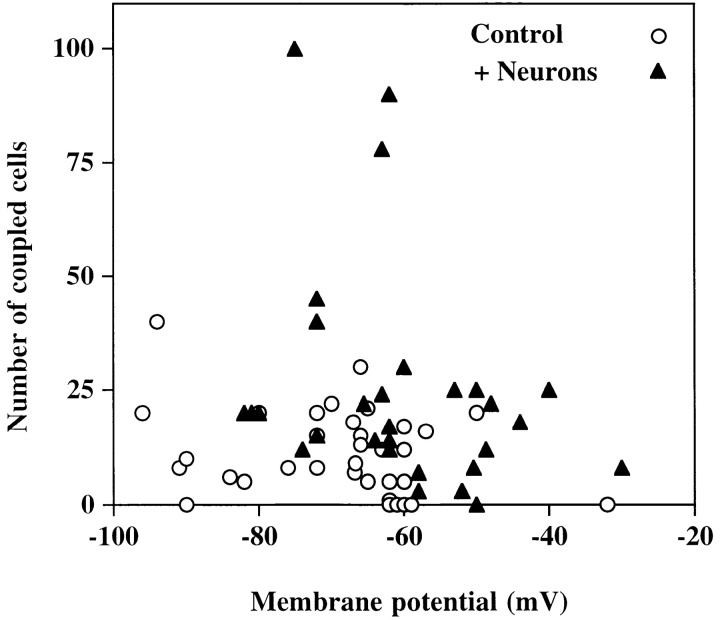
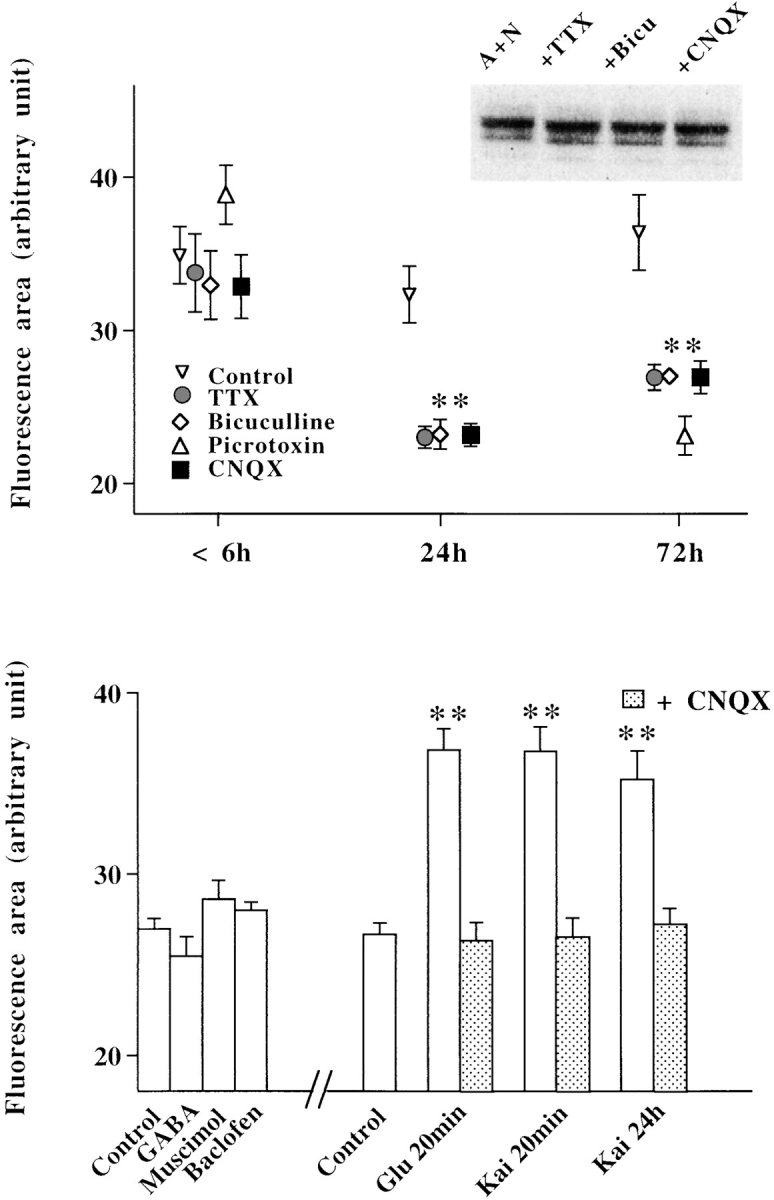
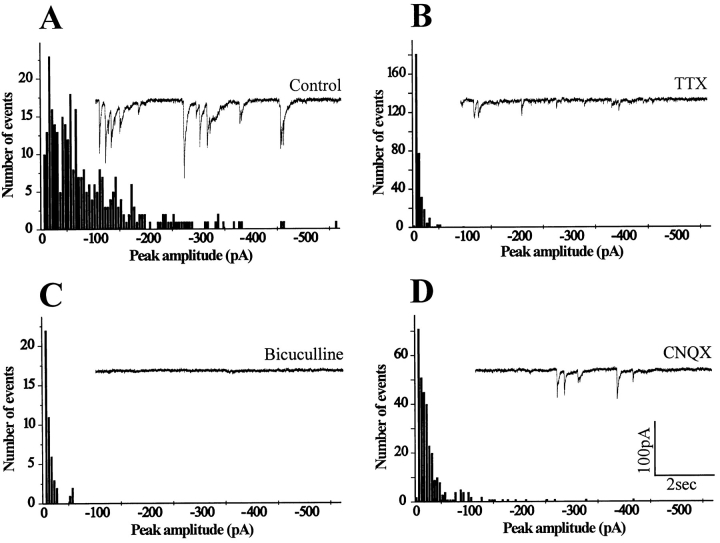
A typical feature of astrocytes is their high degree of intercellular communication through gap junction channels. Using different models of astrocyte cultures and astrocyte/neuron cocultures, we have demonstrated that neurons upregulate gap-junctional communication and the expression of connexin 43 (Cx43) in astrocytes. The propagation of intercellular calcium waves triggered in astrocytes by mechanical stimulation was also increased in cocultures. This facilitation depends on the age and number of neurons, indicating that the state of neuronal differentiation and neuron density constitute two crucial factors of this interaction. The effects of neurons on astrocytic communication and Cx43 expression were reversed completely after neurotoxic treatments. Moreover, the neuronal facilitation of glial coupling was suppressed, without change in Cx43 expression, after prolonged pharmacological treatments that prevented spontaneous synaptic activity. Altogether, these results demonstrate that neurons exert multiple and differential controls on astrocytic gap-junctional communication. Since astrocytes have been shown to facilitate synaptic efficacy, our findings suggest that neuronal and astrocytic networks interact actively through mutual setting of their respective modes of communication.


Figures

Figure 1
Figure 1
Dye coupling between astrocytes is upregulated by neurons. Dye coupling was determined by patch clamp recordings of astrocytes performed with a pipette solution containing 0.2% LY. A–D, Light micrographs taken with Hoffman optics of (A) astrocyte culture and (C) spontaneous coculture and fluorescence micrographs of the same fields (B and D, respectively) taken 5 min after withdrawal of the recording pipettes. The number of dye-coupled cells is increased in the presence of neurons, indicating an increase of the permeability of gap junctions. Bar, 100 μm. Bottom, Summary diagram of dye coupling experiments obtained from 184 astrocytes filled with LY and classified in three categories, noncoupled (0), weakly coupled (1–10; stained cells), and highly coupled (>10 stained cells). The threeway χ2 comparison test for the three categories reveals a significant difference in the distribution of astrocytic coupling measured in the absence and presence of neurons (P < 0.01).
Figure 1
Figure 1
Dye coupling between astrocytes is upregulated by neurons. Dye coupling was determined by patch clamp recordings of astrocytes performed with a pipette solution containing 0.2% LY. A–D, Light micrographs taken with Hoffman optics of (A) astrocyte culture and (C) spontaneous coculture and fluorescence micrographs of the same fields (B and D, respectively) taken 5 min after withdrawal of the recording pipettes. The number of dye-coupled cells is increased in the presence of neurons, indicating an increase of the permeability of gap junctions. Bar, 100 μm. Bottom, Summary diagram of dye coupling experiments obtained from 184 astrocytes filled with LY and classified in three categories, noncoupled (0), weakly coupled (1–10; stained cells), and highly coupled (>10 stained cells). The threeway χ2 comparison test for the three categories reveals a significant difference in the distribution of astrocytic coupling measured in the absence and presence of neurons (P < 0.01).
Figure 2
Figure 2
The increasing effect of neurons on astrocytic GJC is age- and density-dependent. A, The level of GJC (astrocytic coupling) was evaluated in N/A and A/N cocultures using the scrape-loading dye transfer technique, and was expressed as arbitrary units referring to the fluorescence area. A significant increase in astrocytic GJC was first detected 7 d after neuronal plating. The ratios between the fluorescence areas of tests (N/A cocultures) and internal controls (astrocyte cultures) are: 1.01, 1.47, and 1.41 for 1–5, 7, and 10 d, respectively. Similar observations were performed using A/N cocultures. The ratios between the fluorescence areas of tests and internal controls are: 1.01 and 1.68 for 5 and 10 d, respectively. The number of independent experiments shown varied from 4 to 18. Statistical analysis was carried out by t test. B, Western blot analysis of the Cx43 carried out on cellular extracts prepared, at the indicated ages, from neuronal cultures, astrocyte cultures, and cocultures (N, A, and A+N, respectively). The increasing effect of neurons on Cx43 expression was observed 1 wk after neuronal plating. Note that of the three isoforms (NP, P1, and P2) of Cx43, P2 predominated, and that the proportion was not modified by neurons. Data are representative of four to ten independent experiments. C, Effect of the proportion of neurons versus astrocytes on astrocytic GJC evaluated in N/A cocultures using the scrape-loading dye transfer technique. Several proportions were tested and corresponded to seeding of 50, 100, 500, 1,000, and 2,000 × 103 neurons per 35-mm diam culture dish in which confluent astrocytes were cultured for 2 wk. The ratios between the fluorescence areas of tests and internal controls are: 1.06, 1.04, 1.27, 1.48, and 1.49 for the above indicated seeding densities, respectively. Four independent experiments were performed and statistical significance was established by one-way ANOVA, followed by post hoc Dunnett's multiple comparison.
Figure 3
Figure 3
Patch clamp recordings of Na+ inward currents recorded from neurons in N/A cocultures 4 d (A1 and A2) and 10 d (B1 and B2) after neuronal plating. A1 and B1, Superimposed traces of currents in response to depolarizing pulses of +70, +80, +90, and +100 mV stepped from a holding potential of –100 mV. A2–B2, Occurrence of spontaneous synaptic inward currents illustrated by three consecutive current traces recorded at a holding potential of –60 mV. Current traces shown in A1 and A2 and B1 and B2 were from the same cells and were obtained with pipettes filled with a CsCl solution.
Figure 4
Figure 4
Effect of neurons on the extent of calcium wave propagation in astrocytes. Changes in [Ca2+]i were monitored in astrocytes cultures (A) and N/A cocultures (B) by calcium imaging in cells loaded with Indo1-AM. Unitary cell stimulation (white arrows) was achieved by mechanical stimulation of a single astrocyte. The left-hand black and white images correspond to the fluorescence images taken at 480 nm. The propagation of a calcium wave is illustrated by sequential images taken at the indicated times and by pseudocolor representations of [Ca2+]i expressed as the ratio of Indo1-AM emissions (F 450/F 480) caused by excitation at 355 nm. Note that in addition to the increase in astrocytic [Ca2+]i, a subpopulation of neurons identified as white spots in the 480-nm image also responded to the mechanical stimulation by a rise in [Ca2+]i. The scale refers to ratios from 0.01–1.00 that, in astrocytes, corresponded to estimated [Ca2+]i values of 10–1,200 nM, respectively. Bar, 25 μm. C, Summary diagram representing the ratio between responding astrocytes and the total number of astrocytes from microscopic fields in astrocyte cultures (Control) and in N/A cocultures (+ Neurons). Statistical significance of the effect of neurons was established for each time after neuronal plating by Student's unpaired t test. The ratios between tests (N/A cocultures) and internal controls (astrocyte cultures) are: 0.81, 1.29, and 1.34 for 3–4, 6–7, and 10 d, respectively. These analyses were performed in 99 fields obtained from four independent experiments detailed in Table .
Figure 4
Figure 4
Effect of neurons on the extent of calcium wave propagation in astrocytes. Changes in [Ca2+]i were monitored in astrocytes cultures (A) and N/A cocultures (B) by calcium imaging in cells loaded with Indo1-AM. Unitary cell stimulation (white arrows) was achieved by mechanical stimulation of a single astrocyte. The left-hand black and white images correspond to the fluorescence images taken at 480 nm. The propagation of a calcium wave is illustrated by sequential images taken at the indicated times and by pseudocolor representations of [Ca2+]i expressed as the ratio of Indo1-AM emissions (F 450/F 480) caused by excitation at 355 nm. Note that in addition to the increase in astrocytic [Ca2+]i, a subpopulation of neurons identified as white spots in the 480-nm image also responded to the mechanical stimulation by a rise in [Ca2+]i. The scale refers to ratios from 0.01–1.00 that, in astrocytes, corresponded to estimated [Ca2+]i values of 10–1,200 nM, respectively. Bar, 25 μm. C, Summary diagram representing the ratio between responding astrocytes and the total number of astrocytes from microscopic fields in astrocyte cultures (Control) and in N/A cocultures (+ Neurons). Statistical significance of the effect of neurons was established for each time after neuronal plating by Student's unpaired t test. The ratios between tests (N/A cocultures) and internal controls (astrocyte cultures) are: 0.81, 1.29, and 1.34 for 3–4, 6–7, and 10 d, respectively. These analyses were performed in 99 fields obtained from four independent experiments detailed in Table .
Figure 5
Figure 5
Reversal of the neuronal upregulation of astrocytic GJC by NMDA neurotoxic treatment. Phase-contrast micrographs of control N/A cocultures 11 d after neuronal plating without (A) and with (B) exposure to 300 μM NMDA in the absence of external Mg2+. Cells were incubated for 1 h and then fixed 24 h later. Bar, 100 μm. C, Summary diagram of the effect of NMDA treatment on astrocytic GJC measured using the scrape-loading technique in astrocyte cultures (Control) and in N/A cocultures (+ Neurons). Statistical analysis was carried out by one-way ANOVA, followed by post hoc Bonferroni's multiple comparison. The ratios between the fluorescence areas of tests (N/A cocultures) and internal controls (astrocyte cultures) are: 1.47 in nontreated cells and 0.97 in NMDA-treated cells. These analysis were carried out from four to six independent experiments. D, Western blot analysis of Cx43 expression in astrocyte cultures (A), untreated N/A cocultures 11 d after neuronal plating (A+N), and in NMDA-treated cocultures (A+N+NMDA).
Figure 6
Figure 6
Lack of correlation between dye coupling and resting membrane potential in astrocytes. Whole cell recordings were performed with a pipette filled with LY 0.2% in cultures of astrocytes (Control) and in spontaneous cocultures (+ Neurons). Resting membrane potential was measured under current clamp conditions 1 min after rupture of the membrane, whereas the number of coupled cells was counted after 6 min. The plotting of these two parameters indicated that there is no relationship between the membrane potential of the recorded astrocytes and the number of coupled cells.
Figure 7
Figure 7
Effect of Na+ channel blocker, receptor antagonists, and neurotransmitters on the astrocytic GJC measured using the scrape-loading technique. Top, Treatments of N/A cocultures performed during the indicated times in the presence of either 1 μM TTX, 10 μM bicuculline (Bicu), 100 μM picrotoxin, or 10 μM CNQX; controls refer to nontreated N/A cocultures. For each indicated treatment duration, statistical significance of the effect of treatments was established by one-way ANOVA, followed by post hoc Dunnett's multiple comparison. The ratios between the fluorescence areas of internal controls (nontreated N/A cocultures) and tests (TTX, bicuculine, picrotoxin, and CNQX) are: 0.97, 0.94, 0.94, and 1.11 for <6 h; 0.71, 0.72, and 0.72 (picrotoxin nontested) for 24h; 0.74, 0.74, 0.74, and 0.64 for 72 h. These analyses were carried out from four to ten independent experiments. Insert, Western blot analysis of Cx43 expression in untreated N/A cocultures (A+N) after 24–72 h exposure to the indicated compounds. Note that there was no change in the level and proportion of the three Cx43 isoforms. Data are representative of four to eight independent experiments. Bottom, Effect of agonists and antagonists of the GABAA, GABAB, and AMPA/kainate receptors on astrocytic GJC studied in astrocytes cultures. Unless indicated, the compounds were used at the following concentration and incubation duration: 0.01–1 mM GABA (10 min to 72 h) with 10 μM nipecotic acid; 30–500 μM muscimol (20 min to 24 h); 100–400 μM baclofen (20 min to 24 h); 400 μM glutamate; 400 μM kainate; 10 μM CNQX. Statistical significance of the effect of treatments was established by one-way ANOVA, followed by post hoc Dunnett's multiple comparison. The ratios between the fluorescence areas of tests and internal controls are: 0.94 for GABA, 1.06 for muscimol, 1.04 for baclofen, 1.38 for glutamate, 0.99 for glutamate+CNQX, 1.38 for kainate (20 min), 0.99 for kainate (20 min)+CNQX, 1.32 for kainate (24h), and 1.02 for kainate (24h)+CNQX. The number of independent experiments shown varied from four to 14.
Figure 8
Figure 8
Effect of Na+ channel blocker and receptor antagonists on spontaneous synaptic activity recorded from neurons in N/A cocultures. A–D, Neurons were clamped at −60 mV and studied 24–72 h after treatments with either 1 μM TTX, 10 μM bicuculline, or 10 μM CNQX. Amplitude histograms were obtained by analyzing 300 events in each situation (A, B, and D), except in C since very few events were detected in the presence of bicuculline (n = 47, for an overall recording duration of 34 min). Only transient with uninterrupted rising phases were included to eliminate any signals involving multiple discharges.

Similar articles

Cited by

References

    1. Araque A., Parpura V., Sanzgiri R.P., Haydon P.G. Glutamate-dependent astrocyte modulation of synaptic transmission between cultured hippocampal neurons. Eur. J. Neurosci. 1998;10:2129–2142. - PubMed
    1. Araque A., Parpura V., Sanzgiri R.P., Haydon P.G. Tripartite synapsesglia, the unacknowledged partner. TINS. 1999;22:208–215. - PubMed
    1. Bacci A., Verderio C., Pravettoni E., Matteoli M. Synaptic and intrinsic mechanisms shape synchronous oscillations in hippocampal neurons in culture. Eur. J. Neurosci. 1999;11:389–397. - PubMed
    1. Bezzi P., Carmignoto G., Pasti L., Vesce S., Rossi D., Lodi Rizzini B., Pozzan T., Volterra A. Prostaglandins stimulate calcium-dependent glutamate release in astrocytes. Nature. 1998;391:281–285. - PubMed
    1. Bruzzone R., Giaume C. Connexins and information transfer through glia. In: Matsas R., Tsacoupoulos M., editors. The Functional Roles of Glial Cells in Health and Disease. Kluwer Academic/Plenum Publishers; New York: 1999. pp. 321–337. - PubMed

MeSH terms