. 2000 Jun 1;28(11):E52.
doi: 10.1093/nar/28.11.e52.

Using molecular beacons as a sensitive fluorescence assay for enzymatic cleavage of single-stranded DNA

Affiliations

Using molecular beacons as a sensitive fluorescence assay for enzymatic cleavage of single-stranded DNA

J J Li et al. Nucleic Acids Res. .

Abstract

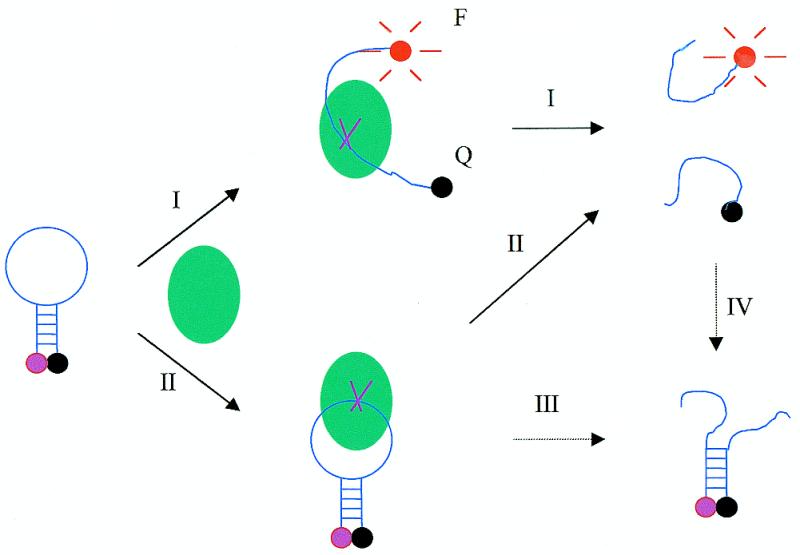
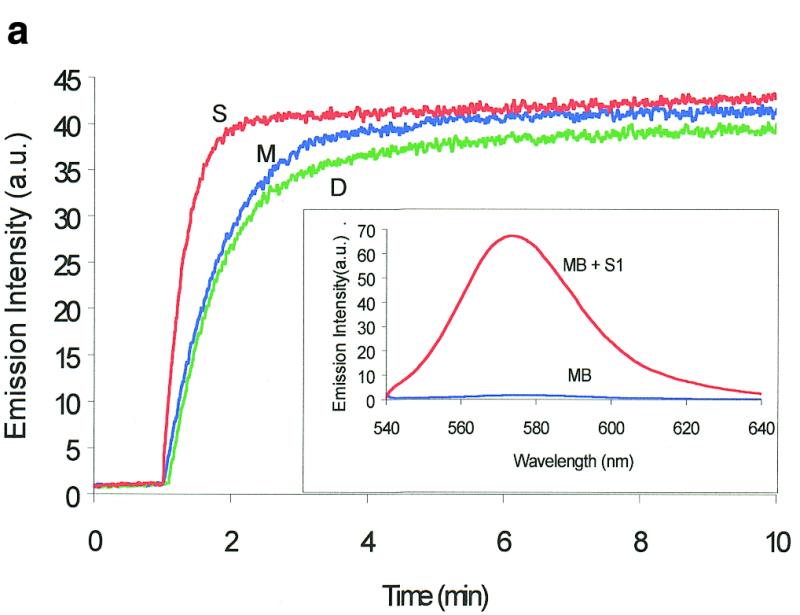
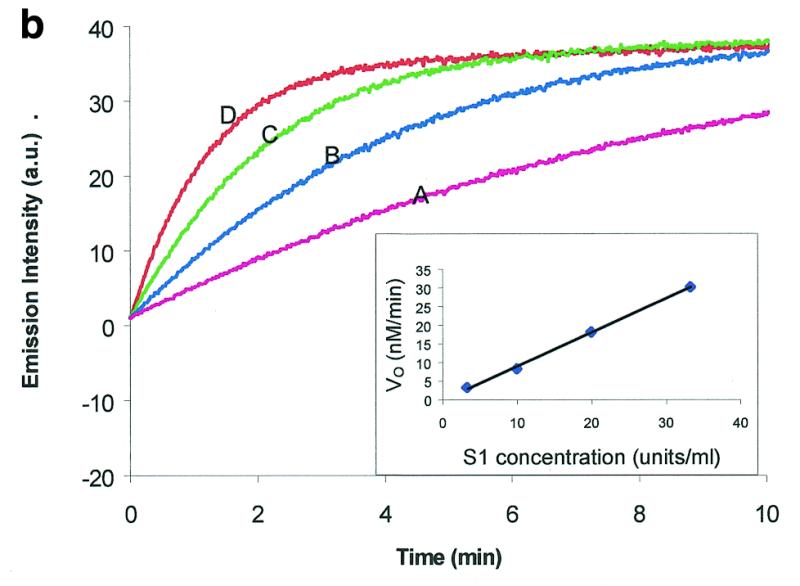
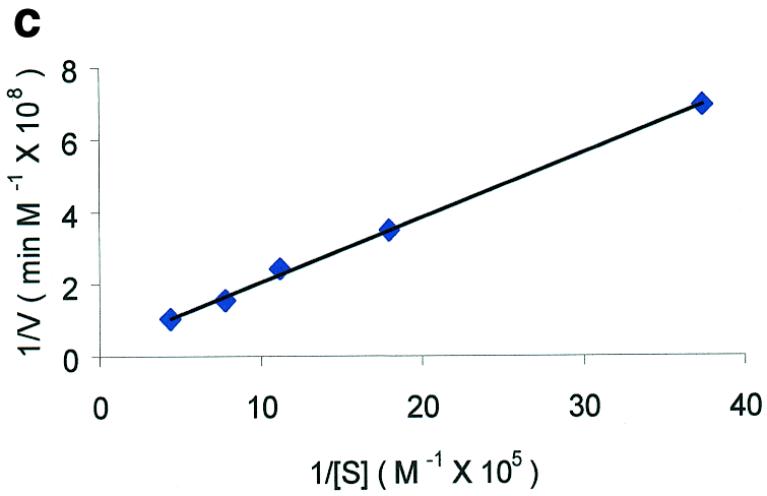
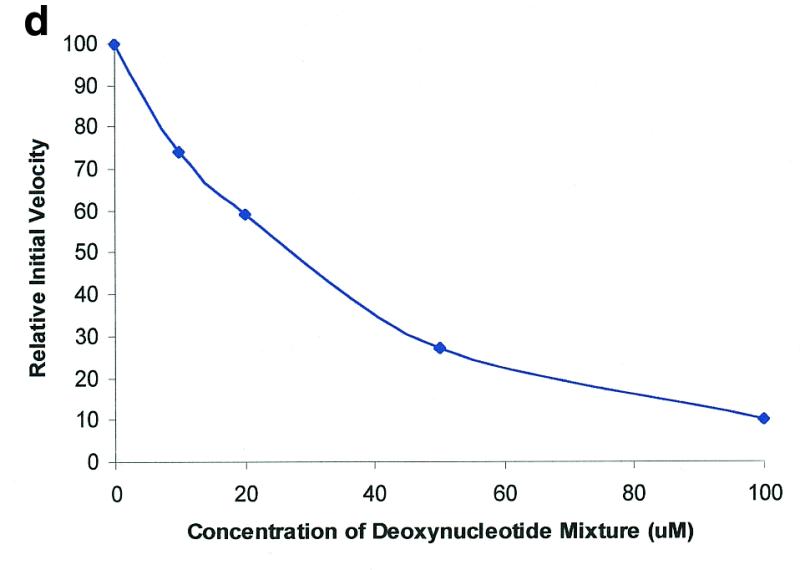
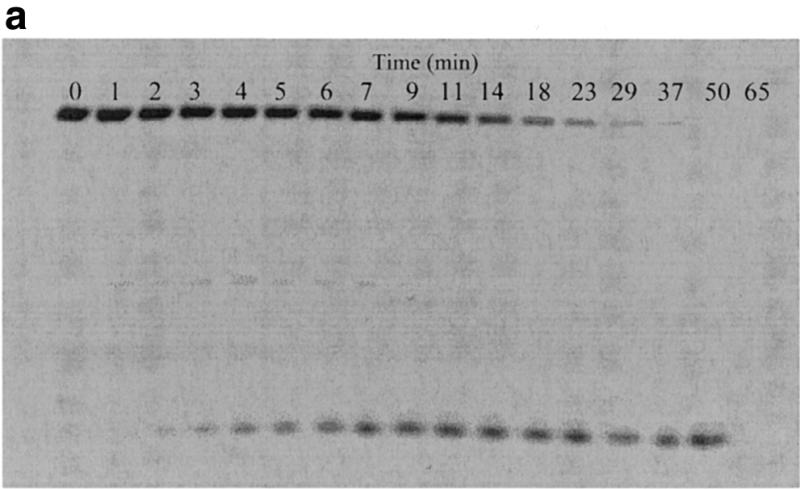
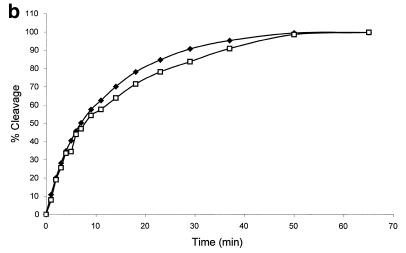
Traditional methods to assay enzymatic cleavage of DNA are discontinuous and time consuming. In contrast, recently developed fluorescence methods are continuous and convenient. However, no fluorescence method has been developed for single-stranded DNA digestion. Here we introduce a novel method, based on molecular beacons, to assay single-stranded DNA cleavage by single strand-specific nucleases. A molecular beacon, a hairpin-shaped DNA probe labeled with a fluorophore and a quencher, is used as the substrate and enzymatic cleavage leads to fluorescence enhancement in the molecular beacon. This method permits real time detection of DNA cleavage and makes it easy to characterize the activity of DNA nucleases and to study the steady-state cleavage reaction kinetics. The excellent sensitivity, reproducibility and convenience will enable molecular beacons to be widely useful for the study of single-stranded DNA cleaving reactions.


Figures

Figure 1
Figure 1
Schematic representation of the fluorescence mechanism of the molecular beacon during cleavage by single-strand-specific DNA nuclease (indicated by solid arrows). The solid arrows indicate two paths (I and II) leading to fluorescence enhancement during digestion. The dashed arrows represent two possible processes (III and IV) in which no fluorescence enhancement is produced. Only the first cut is shown here. Even though the nuclease may keep on cutting one single strand many times, only the first cut contributes to the fluorescence signal increase. The ball represents the nuclease. MB, F and Q represent molecular beacon, fluorophore and quencher, respectively. Here the fluorophore and quencher are tetramethylrhodamine (TAMRA) and 4-(4′-dimethylaminophenylazo)benzoic acid (DABCYL), respectively.
Figure 2
Figure 2
Molecular beacon assay for the cleavage of single-stranded DNA. All cleavage reactions catalyzed by S1 (Promega, Madison, WI) and mung bean (New England Biolabs, Beverly, MA) nucleases were carried out in a buffer consisting of 50 mM NaAc, pH 5.0, 30 mM NaCl, 1 mM ZnSO4. The cleavage buffer for DNase I (Sigma, St Louis, MO) was similar except that ZnSO4 was replaced by 2 mM MgCl2. All reactions were performed at 37°C. All excitation and emission wavelengths for time curves were 558 and 580 nm, respectively, except that 530 nm excitation was used for the emission spectrum. (a) Time curves of the fluorescence intensity of the molecular beacon during digestion by several nucleases. S, M and D represent S1 and mung bean nucleases and DNase I, respectively. (Inset) Fluorescence spectrum of the molecular beacon before (molecular beacon) and after digestion (molecular beacon + S1). [Molecular beacon] = 500 nM; [S1 nuclease] = 200 U/ml; [DNase I] = 1.6 U/ml; [mung bean nuclease] = 500 U/ml. (b). Time curves of cleavage of the molecular beacon by S1 nuclease at different enzyme concentrations. (Insert) Initial cleavage velocity as a function of increasing S1 concentration. [Molecular beacon] = 50 nM; 1 U of S1 nuclease = 7.8 × 10⁻¹⁴ mol. (c) Lineweaver–Burk plot of the cleavage reaction of molecular beacon by S1 nuclease. [S1 nuclease] = 0.015 nM. The concentration of molecular beacon was changed from 120 to 2300 nM. (d) Inhibitory effect of deoxynucleoside triphosphates (dNTP) on the initial cleavage velocity of the molecular beacon by S1 nuclease. [Molecular beacon] = 100 nM; [S1 nuclease] = 10 U/ml. The dNTP solution contained equal moles of dATP, dGTP, dTTP and dCTP.
Figure 2
Figure 2
Molecular beacon assay for the cleavage of single-stranded DNA. All cleavage reactions catalyzed by S1 (Promega, Madison, WI) and mung bean (New England Biolabs, Beverly, MA) nucleases were carried out in a buffer consisting of 50 mM NaAc, pH 5.0, 30 mM NaCl, 1 mM ZnSO4. The cleavage buffer for DNase I (Sigma, St Louis, MO) was similar except that ZnSO4 was replaced by 2 mM MgCl2. All reactions were performed at 37°C. All excitation and emission wavelengths for time curves were 558 and 580 nm, respectively, except that 530 nm excitation was used for the emission spectrum. (a) Time curves of the fluorescence intensity of the molecular beacon during digestion by several nucleases. S, M and D represent S1 and mung bean nucleases and DNase I, respectively. (Inset) Fluorescence spectrum of the molecular beacon before (molecular beacon) and after digestion (molecular beacon + S1). [Molecular beacon] = 500 nM; [S1 nuclease] = 200 U/ml; [DNase I] = 1.6 U/ml; [mung bean nuclease] = 500 U/ml. (b). Time curves of cleavage of the molecular beacon by S1 nuclease at different enzyme concentrations. (Insert) Initial cleavage velocity as a function of increasing S1 concentration. [Molecular beacon] = 50 nM; 1 U of S1 nuclease = 7.8 × 10⁻¹⁴ mol. (c) Lineweaver–Burk plot of the cleavage reaction of molecular beacon by S1 nuclease. [S1 nuclease] = 0.015 nM. The concentration of molecular beacon was changed from 120 to 2300 nM. (d) Inhibitory effect of deoxynucleoside triphosphates (dNTP) on the initial cleavage velocity of the molecular beacon by S1 nuclease. [Molecular beacon] = 100 nM; [S1 nuclease] = 10 U/ml. The dNTP solution contained equal moles of dATP, dGTP, dTTP and dCTP.
Figure 3
Figure 3
Correlation of fluorescence assay and gel electrophoresis assay for the cleavage of the molecular beacons by S1 nuclease. The reactions were performed as described in Figure 2 with the following changes: 6 µM molecular beacon, 20 U/ml S1, 400 µl reaction volume. The time driving curve was recorded after the addition of 0.8 µl of S1 into the molecular beacon solution. For the gel electrophoresis assay, 10 µl samples of the reaction mixture were removed at specific time points from the fluorescence cuvette and added to 4 µl of 1 M Tris–HCl buffer (pH 7.8) on ice to quench the reaction. (a) Polyacrylamide gel assay for cleavage of the molecular beacon by S1 nuclease. The samples were run on a 15% denaturing polyacrylamide gel to separate the cleaved products from the substrate. Fluorescence image was taken by exciting the fluorophore in the molecular beacon or in the cleaved fragments. The upper band represents the uncleaved molecular beacon and the reaction time points (min) are presented above the bands. (b) Comparison of percentage of molecular beacon cleavage between the fluorescence assay (closed diamonds) and the gel electrophoresis assay (open squares). The fluorescence assay curve was extracted from the time driving curve, while the percentage of substrate cleavage at each time point for the gel electrophoresis assay was determined by quantifying the fluorescence decrease of the intact substrate relative to the total fluorescence using Bio-Rad Gel Doc 1000®.
Figure 3
Figure 3
Correlation of fluorescence assay and gel electrophoresis assay for the cleavage of the molecular beacons by S1 nuclease. The reactions were performed as described in Figure 2 with the following changes: 6 µM molecular beacon, 20 U/ml S1, 400 µl reaction volume. The time driving curve was recorded after the addition of 0.8 µl of S1 into the molecular beacon solution. For the gel electrophoresis assay, 10 µl samples of the reaction mixture were removed at specific time points from the fluorescence cuvette and added to 4 µl of 1 M Tris–HCl buffer (pH 7.8) on ice to quench the reaction. (a) Polyacrylamide gel assay for cleavage of the molecular beacon by S1 nuclease. The samples were run on a 15% denaturing polyacrylamide gel to separate the cleaved products from the substrate. Fluorescence image was taken by exciting the fluorophore in the molecular beacon or in the cleaved fragments. The upper band represents the uncleaved molecular beacon and the reaction time points (min) are presented above the bands. (b) Comparison of percentage of molecular beacon cleavage between the fluorescence assay (closed diamonds) and the gel electrophoresis assay (open squares). The fluorescence assay curve was extracted from the time driving curve, while the percentage of substrate cleavage at each time point for the gel electrophoresis assay was determined by quantifying the fluorescence decrease of the intact substrate relative to the total fluorescence using Bio-Rad Gel Doc 1000®.

References

    1. Linn S.M. and Roberts,R.J. (1982) Nucleases. Cold Spring Harbor Laboratory Press, Cold Spring Harbor, NY.
    1. Linn S.M., Lloyd,R.S. and Roberts,R.J. (1993) Nucleases, 2nd Edn. Cold Spring Harbor Laboratory Press, Cold Spring Harbor, NY.
    1. Sambrook J., Fritsch,E.F. and Maniatis,T. (1989) Molecular Cloning: A Laboratory Mannual, 2nd Edn. Cold Spring Harbor Laboratory Press, Cold Spring Harbor, NY.
    1. McLaughlin L.W., Benseler,F., Graeser,E., Piel,N. and Scholtissek,S. (1987) Biochemistry, 26, 7238–7245. - PubMed
    1. Alves J., Ruter,T., Geiger,R., Fliess,A., Maass,G. and Pingoud,A. (1989) Biochemistry, 28, 2678–2684. - PubMed

Publication types