. 2000 Jul 1;28(13):2494-502.
doi: 10.1093/nar/28.13.2494.

Quantitative characterization of the interaction between purified human estrogen receptor alpha and DNA using fluorescence anisotropy

Affiliations

Quantitative characterization of the interaction between purified human estrogen receptor alpha and DNA using fluorescence anisotropy

M Boyer et al. Nucleic Acids Res. .

Abstract

In an effort to better define the molecular mechanisms of the functional specificity of human estrogen receptor alpha, we have carried out equilibrium binding assays to study the interaction of the receptor with a palindromic estrogen response element derived from the vitellogenin ERE. These assays are based on the observation of the fluorescence anisotropy of a fluorescein moiety covalently bound to the target oligonucleotide. The low anisotropy value due to the fast tumbling of the free oligonucleotide in solution increases substantially upon binding the receptor to the labeled ERE. The quality of our data are sufficient to ascertain that the binding is clearly cooperative in nature, ruling out a simple monomer interaction and implicating a dimerization energetically coupled to DNA binding in the nanomolar range. The salt concentration dependence of the affinity reveals formation of high stoichiometry, low specificity complexes at low salt concentration. Increasing the KCl concentration above 200 mM leads to specific binding of ER dimer. We interpret the lack of temperature dependence of the apparent affinity as indicative of an entropy driven interaction. Finally, binding assays using fluorescent target EREs bearing mutations of each of the base pairs in the palindromic ERE half-site indicate that the energy of interaction between ER and its target is relatively evenly distributed throughout the site.


Figures
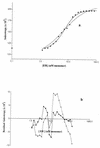
Figure 1
Figure 1
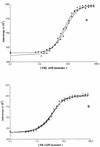
(a) Fluorescence anisotropy profile of full-length human ERα binding to 1 nM 5′-fluorescein labeled vit-ERE in 200 mM KCl in TD buffer at 21°C. The full line through the data points represents the fit to the data using the cooperative model including a monomer-bound intermediate as described in the Materials and Methods. The dotted line represents a fit with a simple binding model. (b) Residuals of the fit to the cooperative (full line) and simple (dashed line) binding models. The point plotted at the lowest protein concentration is in fact obtained in the absence of protein.
Figure 2
Figure 2
Salt concentration dependence of ER–ERE interactions. (a) Profiles for titrations of F-vitERE obtained in presence of 150 (open circles), 200 (squares), 250 (triangles) and 300 mM KCl (closed circles); (b) profiles obtained for F-vitERE at 200 mM KCl (squares), a mutant sequence mutF (see Fig. 5) at 200 mM KCl (circles) and in the absence of salt (triangles). The profiles were obtained in TD buffer at 21°C, and the DNA concentration was 1 nM. In this case the DNA target was labeled on the 5′-end through a six-carbon linker. Lines through the points represent fits to the data in terms of the model described in the Materials and Methods. The points plotted at the lowest protein concentration were obtained in the absence of protein.
Figure 3
Figure 3
Ligand dependence ER–ERE interactions. (a) F-vitERE titrated with ERα in the absence of ligand (squares) and in the presence of 0.1 mM E2 (circles); (b) F-vitERE titrated with ERα in the absence of ligand (squares), in the presence of 0.1 mM ICI (triangles) and in the presence of 0.1 mM OH-Tam (circles). The profiles were obtained in TD buffer in the presence of 200 mM KCl at 21°C, and the DNA concentration was 1 nM. In this case the DNA target was labeled through a fluorescein labeled thymine residue at position +5 from the 5′-end. Lines through the points represent fits to the data in terms of the model described in the Materials and Methods. The points plotted at the lowest protein concentration were obtained in absence of protein.
Figure 4
Figure 4
Temperature dependence of ER–ERE interactions. Normalized titrations for 4 (triangles), 21 (squares) and 32°C (circles). Profiles were obtained using the 5′-fluorescein labeled F-vitERE at a concentration of 1 nM in TD buffer with 200 mM KCl. The data were fit and then the raw data and the fits were normalized for comparison, to eliminate differences due to temperature dependence of solution viscosity. Lines represent fits of the data to the model described in the Materials and Methods. The points plotted at the lowest protein concentration were obtained in the absence of protein.
Figure 5
Figure 5
Sequences of the wild-type and mutant oligonucleotides used in the present study. These targets were all 5′-labeled with fluorescein through a six-carbon phosphoramidite linker as described in the text.
Figure 6
Figure 6
Sequence dependence of ER–ERE interactions. Titrations are shown for F-vitERE (closed squares), mutA (open triangles), mutB (open circles), mutC (closed triangles), mutD (diamonds), mutE (asterisks), mutF (open squares) and CathD (closed circles). Titrations were carried out using 1–2 nM target DNA in TD buffer at 21°C in the presence of 200 mM KCl. Lines through the points represent fits to the data for the mutant targets using a simple binding model, and for the F-vitERE using the cooperative model described in the Materials and Methods. The point plotted at the lowest protein concentration was obtained in the absence of protein.
Figure 7
Figure 7
Schematic representation of the interactions between the ER-DBD and the target ERE reproduced from the schematic given by Schwabe and co-workers (20) based on their crystallographically determined structure. In our schematic the half site bases are labeled from 1 to 6 (sense strand) and –1 to –6 (anti-sense strand). Water molecules are represented by filled circles and H-bonds by arrows.

References

    1. Mangelsdorf D., Thummel,C. and Beato,M. (1995) Cell, 83, 835–839. - PMC - PubMed
    1. McKenna N.J., Lanz,R.B. and O’Malley,B.W. (1999) Endocrin. Rev., 20, 321–344. - PubMed
    1. Murdoch F.E., Meier,D.A., Furlow,J.D., Grunwald,K.A.A. and Gorski,J. (1990) Biochemistry, 29, 8377–8385. - PubMed
    1. Murdoch F.E., Grunwald,K.A.A. and Gorski,J. (1991) Biochemistry, 30, 10838–10844. - PubMed
    1. Furlow J.D., Murdoch,F.E. and Gorski,J. (1993) J. Biol. Chem., 268, 12519–12525. - PubMed

Publication types

MeSH terms