. 2000 Jul 1;116(1):75-99.
doi: 10.1085/jgp.116.1.75.

Voltage and Ca2+ activation of single large-conductance Ca2+-activated K+ channels described by a two-tiered allosteric gating mechanism

Affiliations

Voltage and Ca2+ activation of single large-conductance Ca2+-activated K+ channels described by a two-tiered allosteric gating mechanism

B S Rothberg et al. J Gen Physiol. .

Abstract

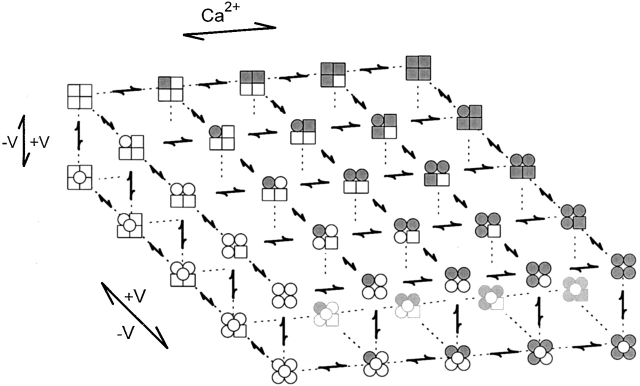
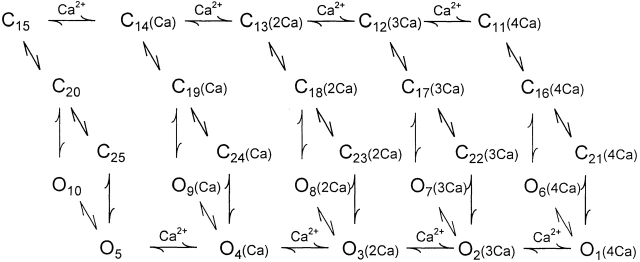
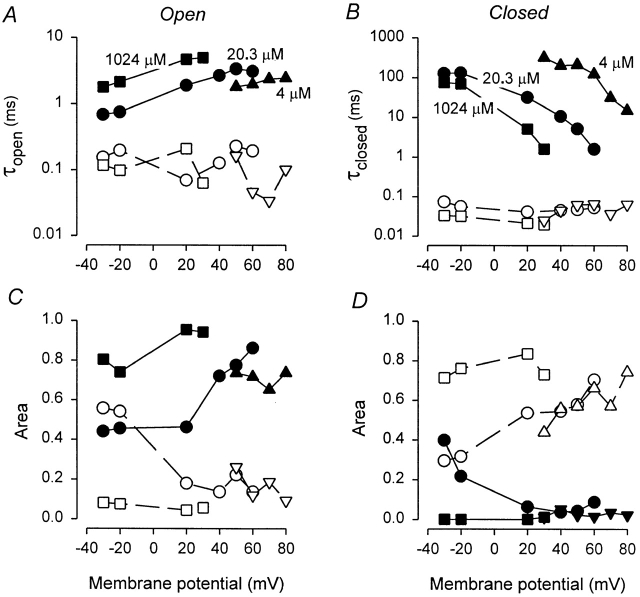
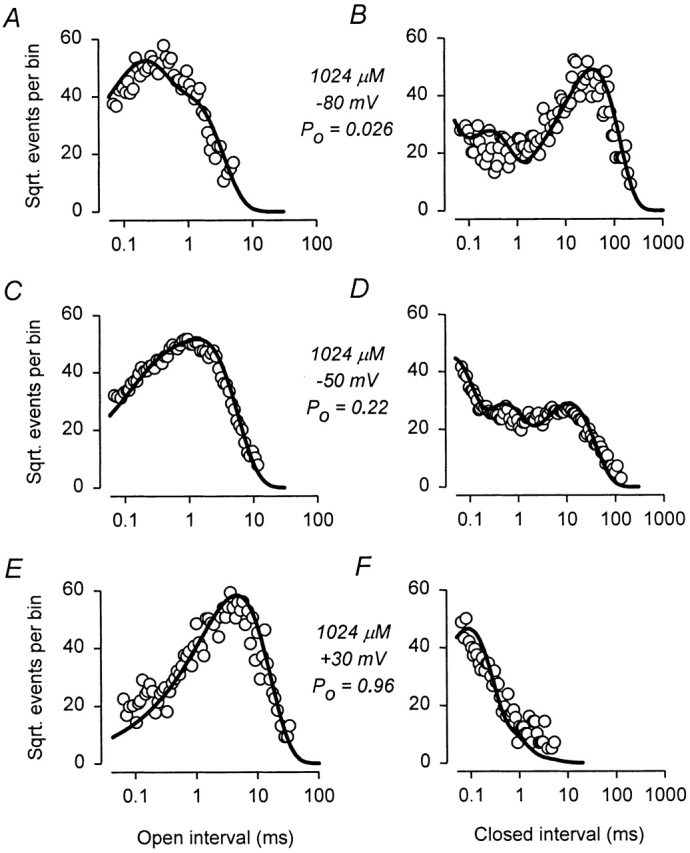
The voltage- and Ca2+-dependent gating mechanism of large-conductance Ca2+-activated K+ (BK) channels from cultured rat skeletal muscle was studied using single-channel analysis. Channel open probability (Po) increased with depolarization, as determined by limiting slope measurements (11 mV per e-fold change in Po; effective gating charge, q(eff), of 2.3 +/- 0.6 e(o)). Estimates of q(eff) were little changed for intracellular Ca2+ (Ca2+(i)) ranging from 0.0003 to 1,024 microM. Increasing Ca2+(i) from 0.03 to 1,024 microM shifted the voltage for half maximal activation (V(1/2)) 175 mV in the hyperpolarizing direction. V(1/2) was independent of Ca2+(i) for Ca2+(i) < or = 0.03 microM, indicating that the channel can be activated in the absence of Ca2+(i). Open and closed dwell-time distributions for data obtained at different Ca2+(i) and voltage, but at the same Po, were different, indicating that the major action of voltage is not through concentrating Ca2+ at the binding sites. The voltage dependence of Po arose from a decrease in the mean closing rate with depolarization (q(eff) = -0.5 e(o)) and an increase in the mean opening rate (q(eff) = 1.8 e(o)), consistent with voltage-dependent steps in both the activation and deactivation pathways. A 50-state two-tiered model with separate voltage- and Ca2+-dependent steps was consistent with the major features of the voltage and Ca2+ dependence of the single-channel kinetics over wide ranges of Ca2+(i) (approximately 0 through 1,024 microM), voltage (+80 to -80 mV), and Po (10(-4) to 0.96). In the model, the voltage dependence of the gating arises mainly from voltage-dependent transitions between closed (C-C) and open (O-O) states, with less voltage dependence for transitions between open and closed states (C-O), and with no voltage dependence for Ca2+-binding and unbinding. The two-tiered model can serve as a working hypothesis for the Ca2+- and voltage-dependent gating of the BK channel.


Figures

Scheme S1
Scheme S1
Scheme S2
Scheme S2
Scheme S3
Scheme S3
Figure 1
Figure 1
Single-channel currents recorded over a range of Ca2+ i and voltage show that BK channels are activated by both depolarization and Ca2+ i. The open (O) and closed (C) current levels are indicated, where upward current steps indicate channel opening at positive potentials and downward current steps indicate channel opening at negative potentials. (A) Activation by Ca2+ i and voltage in the intermediate range of Ca2+ i. Depolarization increases P o (compare the traces at +30 mV with the traces at +40 and +50 mV), and increased Ca2+ i increases P o (compare traces at 5.5 μM with traces obtained at the same voltages at 12.3 μM Ca2+ i). Channel B13. (B) Depolarization increases P o at very low (essentially zero) Ca2+ i. Representative openings are shown as the closed intervals were typically 1–2 s in duration. Channel B14. (C) Depolarization from −80 to −50 mV activates BK channels at high (saturating) Ca2+ i. Channel B16. (D) Longer current traces (10 s) are displayed at a slower time base to illustrate that depolarization increases the frequency of opening at very low Ca2+ i. *Bursts of openings are shown at a fast time base above each trace at the right. Channel B14.
Figure 2
Figure 2
Increasing Ca2+ i shifts voltage-activation curves to more hyperpolarized potentials, while having little effect on the apparent limiting slope. (A) P O vs. voltage is plotted on a linear scale for data obtained from two to three different single-channel patches at each Ca2+ i. The continuous thick lines are fits with the Boltzmann equation: P o = A/{1 + exp [q eff(V − V1/2)/k B T]}, where A was usually fixed at 0.95 (the maximum P o typically observed for these channels). The thin continuous, dashed, and dotted lines represent curves predicted by Q-matrix calculations using Fig. 2 for channels B13, B14, and B16, respectively. (B) Data from A replotted on semilogarithmic coordinates, to emphasize data at very low P o used in limiting slope estimates. The Boltzmann fits are different from those in A due to the log-weighting used to emphasize the data at low open probability to estimate the limiting slope. (C) Effective gating charge per channel (q eff) vs. Ca2+ i. q eff was estimated from individual Boltzmann fits obtained from 16 different P o vs. voltage curves. The thick solid line represents the mean q eff. (D) Plot of the voltage for half-maximal P o (V1/2) vs. Ca2+ i, estimated from the same Boltzmann fits used for C. V1/2 was insensitive to Ca2+ i for Ca2+ i ≤ 0.03 μM, but decreased steeply with Ca2+ i from 4 to 1,000 μM. Symbols in A–D represent channels B07 (○), B10 (□), B11 (▵), B13 (▿), B14 (⋄), B15 (hexagons), and B16 (ȯ). The thin lines in C and D represent predictions using Fig. 2 for channels B13 (continuous line), B14 (dashed line), and B16 (dotted line).
Figure 3
Figure 3
Effects of voltage and Ca2+ i on mean open- and closed-interval durations. (A) Semilogarithmic plots of mean open-interval duration vs. voltage at 5.5, 12.3, and 1,024 μM Ca2+ i for channels B13 (○ and ▵), B14 (⋄) and B16 (▿). The thick lines at each Ca2+ i are fits with single exponentials, and the thin continuous, dashed, and dotted lines represent predicted mean open interval vs. voltage obtained by simulation of Fig. 2 (with filtering and noise; see methods) for channels B13, B14, and B16, respectively. (B) Semilogarithmic plots of mean closed-interval durations vs. voltage at 5.5, 12.3, and 1,024 μM Ca2+ i for the same three channels in A. Lines through each set of points indicate fits with a single exponential, plus a baseline term to account for the minimum mean closed-interval observed at higher Ca2+ i. The thin continuous, dashed, and dotted lines represent predicted mean closed interval vs. voltage obtained by simulation of Fig. 2 for channels B13, B14, and B16, respectively. (C) Effective gating charge (q eff) estimated from 16 individual exponential fits of mean open and closed intervals vs. voltage, plotted as a function of Ca2+ i. The dashed lines at −0.5 and +1.8 indicate the mean q eff for channel closing (determined from the voltage dependence of the mean open intervals) and channel opening (determined from the voltage dependence of the mean closed intervals), respectively. (D) Semilogarithmic plot of the mean opening and closing rates (1/mean closed or open intervals) at +30 mV plotted as a function of Ca2+ i. Thin lines represent predicted values obtained from Q-matrix calculations using Fig. 2 (with correction for missed events) for channels B13, B14, and B16.
Figure 4
Figure 4
Voltage- and Ca2+-induced shifts in the open and closed dwell-time distributions. (A–D) Open dwell-time distributions at +30 and +50 mV for 5.5 and 12.3 μM Ca2+ i. The thin continuous lines are fits to the distributions with the sums of three exponential components. The dashed lines in C and D plot the fits to the distributions obtained at +30 mV on the data obtained at +50 mV at the same Ca2+ i. The thick line in B plots the fit to the distribution in C on the distribution in B. Open distributions obtained at similar P os, but with different Ca2+ i and voltage, are different. (E–H) Open dwell-time distributions at +30 and +50 mV for 5.5 and 12.3 μM Ca2+ i. The thin continuous lines are fits to the distributions with the sums of five exponential components. The dashed lines in G and H plot the fits to the distributions obtained at +30 mV on the data obtained at +50 mV at the same Ca2+ i. The thick line in F plots the fit to the distribution in G on the distribution in F. Closed distributions obtained at similar P os but different Ca2+ i and voltage are different. The numbers of fitted intervals in the distributions were: A, 3,061; B, 5,098; C, 2,384; D, 13,570; E, 2,617; F, 4,248; G, 1,838, and H, 9,728. To facilitate comparison between the dwell-time distributions in this and the following figures, the numbers of intervals in each distribution have been normalized to 100,000 for time ranging from 0 to infinity. Channel B13.
Figure 5
Figure 5
Effects of Ca2+ i and voltage on the time constants and areas of the longest and briefest exponential components describing the open and closed dwell-time distributions. (A) Time constants of the longest (solid symbols) and briefest (open symbols) components of open dwell-time distributions at 4 (up triangles, B13), 20.3 (circles, B16) and 1,024 (squares, B14) μM Ca2+ i. (C) Areas of corresponding components in A. Depolarization generally increased the durations and areas of longest open component. (B and D) Time constants and areas of the longest and briefest components of closed dwell-time distributions. Depolarization generally decreased the durations and areas of the longest closed component.
Figure 6
Figure 6
Dwell-time distributions at very low Ca2+ i. Open and closed dwell-time distributions for 0.0003 μM Ca2+ i at +30 mV (A and B) and +70 mV (C and D), and for 0.03 μM Ca2+ i at +30 mV (E and F) and +70 mV (G and H). Thick solid lines are the predicted dwell-time distributions from Fig. 3 E. Dashed lines are the predicted dwell-time distributions from the 10-state allosteric scheme in Table from Horrigan et al. 1999, using the rate constants denoted as Case A. The model in Table from Horrigan et al. 1999 underpredicts the numbers of experimentally observed brief closed intervals. The numbers of fitted intervals in the distributions were: A, 36; B, 111; C, 159; D, 158; E, 38; F, 58; G, 334; and H, 298;. Channel B14.
Figure 7
Figure 7
Dwell-time distributions at very high (1,024 μM) Ca2+ i. Open and closed dwell-time distributions at −80 mV (A and B), −50 mV (C and D) and +30 mV (E and F). Thick solid lines are the predicted dwell-time distributions from Fig. 3 E. The numbers of fitted intervals in the distributions were: A, 550; B, 514; C, 5,139; D, 3,936; E, 1,113; and F, 647. Channel B16.
Figure 8
Figure 8
Dwell-time distributions over a range of voltage and Ca2+ i. Thick solid lines are the predicted dwell-time distributions from Fig. 2 using the rate constants and partial charge estimates given in Table . The numbers of fitted intervals in the distributions were: C, 90; F, 5,330; I, 93; and L, 3,820; and the same as in Fig. 4 for the remaining distributions. Channel B13.
Figure 9
Figure 9
Voltage-dependent shifts in gating according to Fig. 2. (Inset) Numbers relate the state numbers in Fig. 2 to the states in the various plots. (A and D) Predicted equilibrium state occupancies at 20.3 μM Ca2+ i at −40 and +40 mV, respectively. (B and E) Mean lifetimes of the states at −40 and +40 mV, respectively. (C and F) Frequency of entry into each state at −40 and +40 mV, respectively. Channel B13.

References

    1. Adelman J.P., Sheen E., Kavanaugh M.P., Warren R.A., Wu Y., Lagrutta A., Bond C., North R.A. Calcium-activated potassium channels expressed from cloned complementary DNAs. Neuron. 1992;9:209–216. - PubMed
    1. Akaike H. A new look at the statistical model identification. IEEE Trans. Auto. Control. 1974;19:716–723.
    1. Almers W. Gating currents and charge movements in excitable membranes. Rev. Physiol. Biochem. Pharmacol. 1978;82:96–190. - PubMed
    1. Andersen O.S. Editorialgraphic representation of the results of kinetic analyses. J. Gen. Physiol. 1999;114:589–590. - PMC - PubMed
    1. Atkinson N.S., Robertson G.A., Ganetzky B. A component of calcium-activated potassium channels encoded by the Drosophila slo locus. Science. 1991;253:551–555. - PubMed

Publication types