

Magnetic resonance imaging, radiography, and scintigraphy of the finger joints: one year follow up of patients with early arthritis. The TIRA Group
- PMID: 10873961
- PMCID: PMC1753194
- DOI: 10.1136/ard.59.7.521
Magnetic resonance imaging, radiography, and scintigraphy of the finger joints: one year follow up of patients with early arthritis. The TIRA Group
Abstract
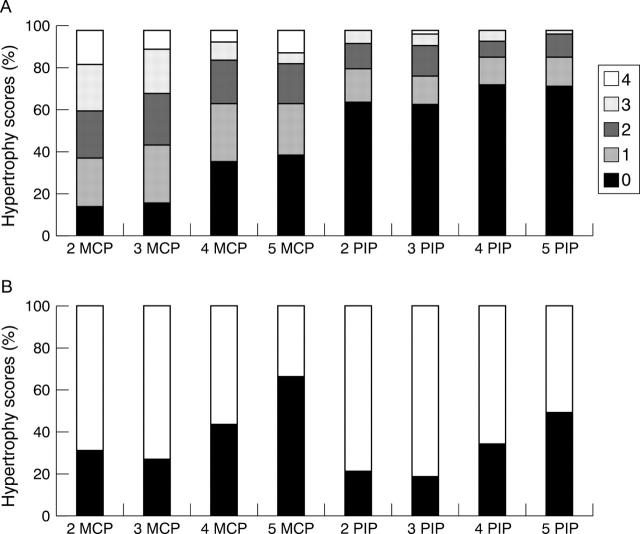
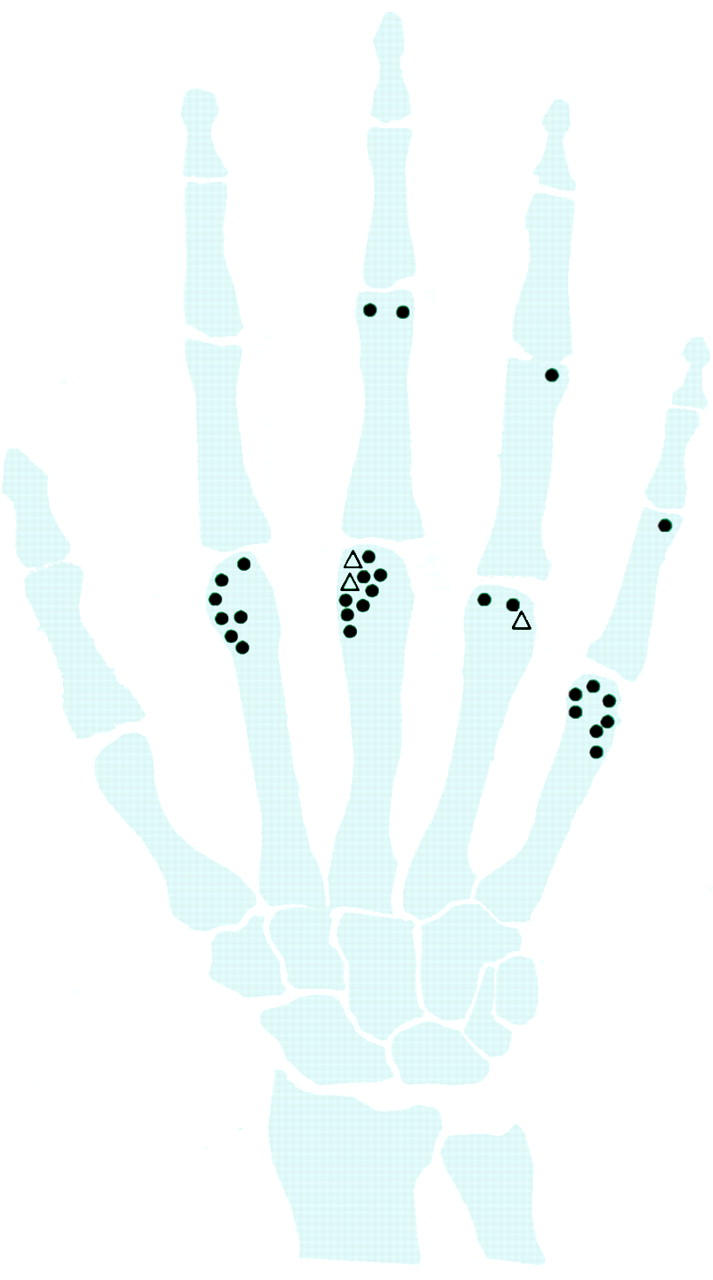
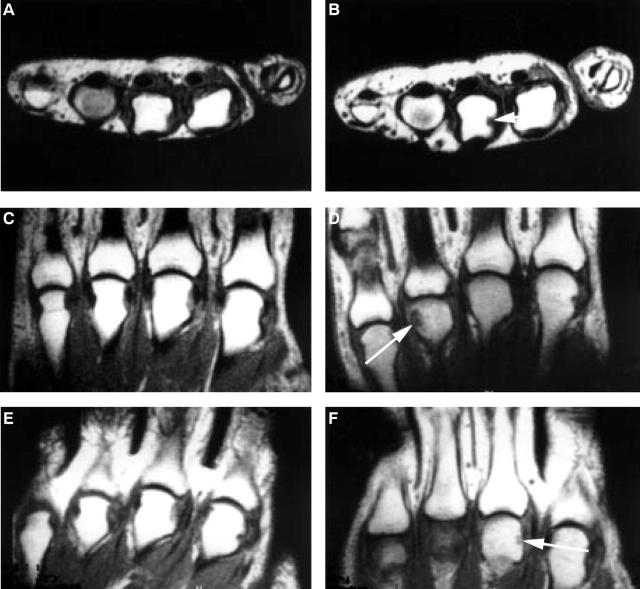
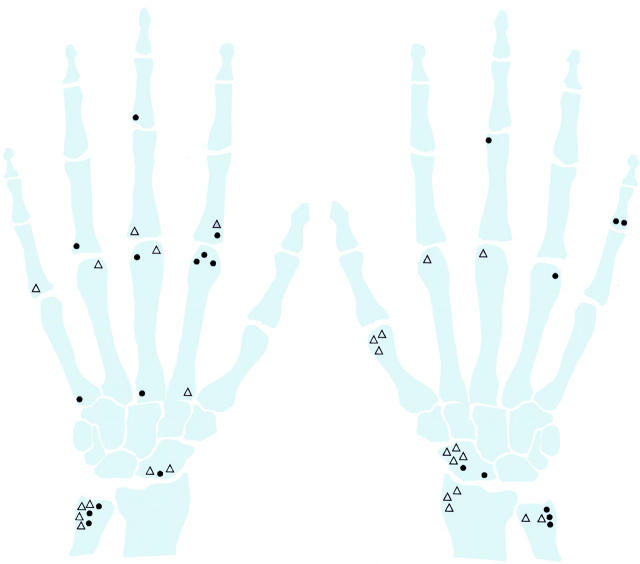
Objectives: To evaluate synovial membrane hypertrophy, tenosynovitis, and erosion development of the 2nd to 5th metacarpophalangeal (MCP) and proximal interphalangeal (PIP) joints by magnetic resonance imaging in a group of patients with rheumatoid arthritis (RA) or suspected RA followed up for one year. Additionally, to compare the results with radiography, bone scintigraphy, and clinical findings.
Patients and methods: Fifty five patients were examined at baseline, of whom 34 were followed up for one year. Twenty one patients already fulfilled the American College of Rheumatology (ACR) criteria for RA at baseline, five fulfilled the criteria only after one year's follow up, whereas eight maintained the original diagnosis of early unclassified polyarthritis. The following MRI variables were assessed at baseline and one year: synovial membrane hypertrophy score, number of erosions, and tenosynovitis score.
Results: MRI detected progression of erosions earlier and more often than did radiography of the same joints; at baseline the MRI to radiography ratio was 28:4. Erosions were exclusively found in patients with RA at baseline or fulfilling the ACR criteria at one year. At one year follow up, scores of MR synovial membrane hypertrophy, tenosynovitis, and scintigraphic tracer accumulation had not changed significantly from baseline; in contrast, swollen and tender joint counts had declined significantly (p<0.05).
Conclusions: MRI detected more erosions than radiography. MR synovial membrane hypertrophy and scintigraphy scores did not parallel the changes seen over time in clinically assessed swollen and tender joint counts. Although joint disease activity may be assessed as quiescent by conventional clinical methods, a more detailed evaluation by MRI may show that a pathological condition is still present within the synovium.
Figures
References
Publication types
MeSH terms
LinkOut - more resources
Full Text Sources
Medical
Miscellaneous
