. 2000 Jul 1;526 Pt 1(Pt 1):143-55.
doi: 10.1111/j.1469-7793.2000.00143.x.

Direct measurement of adenosine release during hypoxia in the CA1 region of the rat hippocampal slice

Affiliations

Direct measurement of adenosine release during hypoxia in the CA1 region of the rat hippocampal slice

N Dale et al. J Physiol. .

Abstract

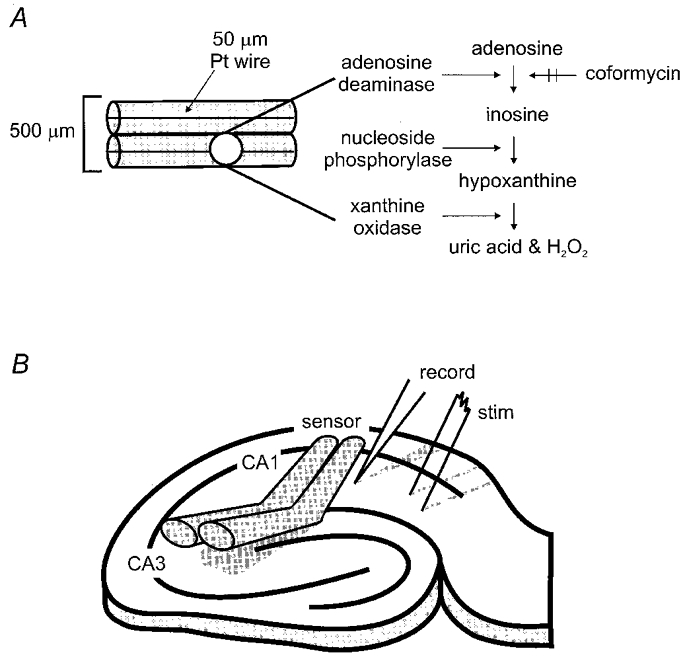
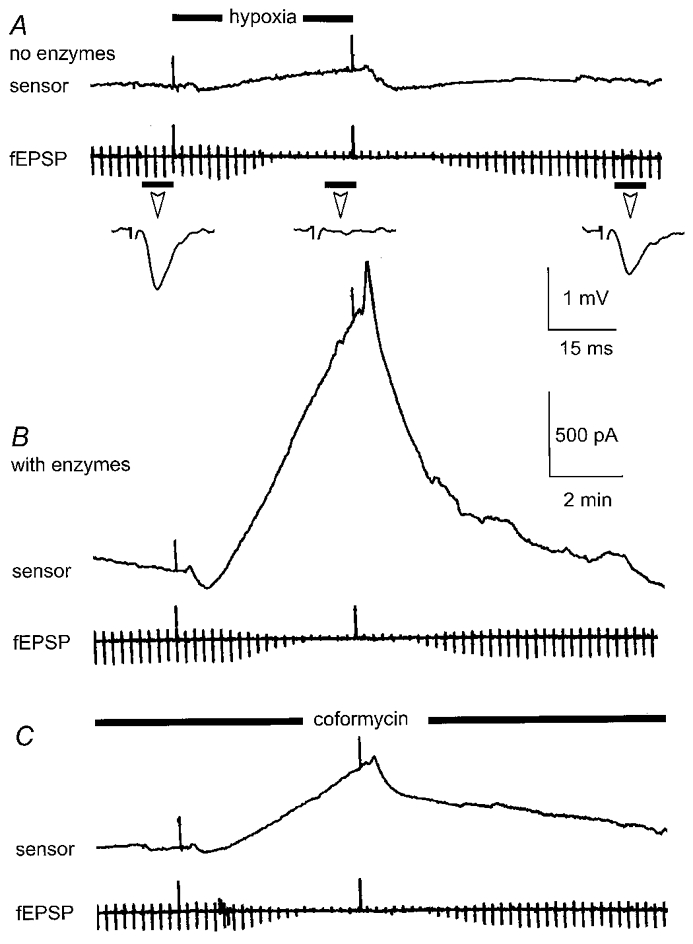
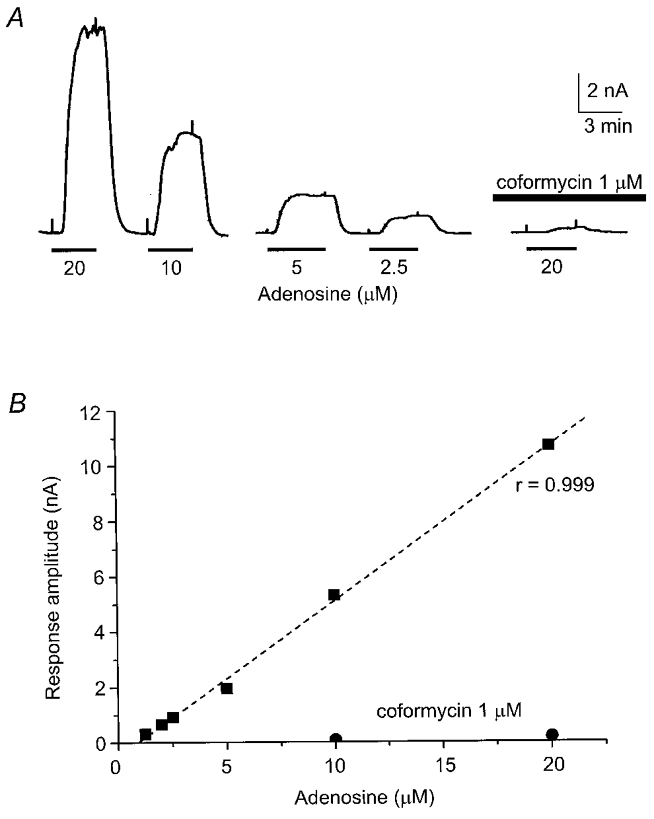
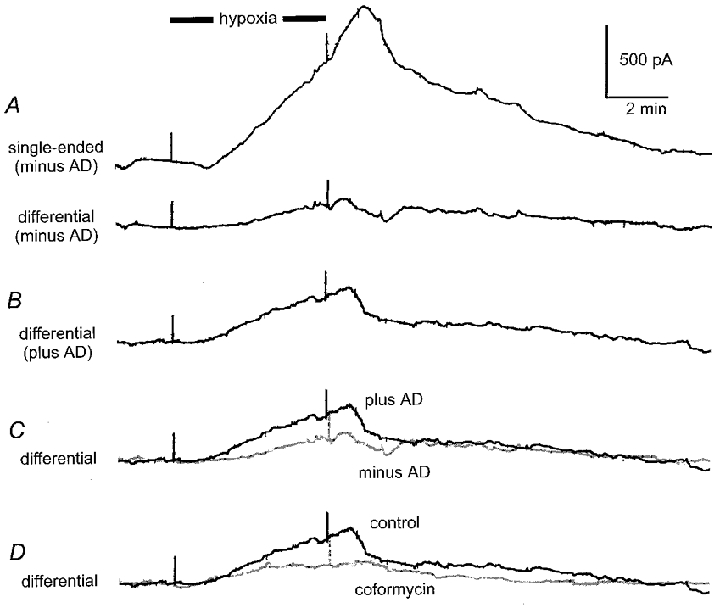
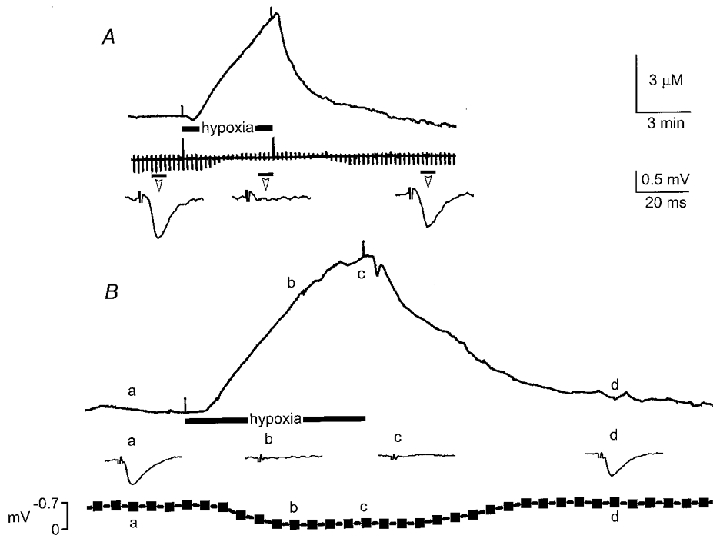
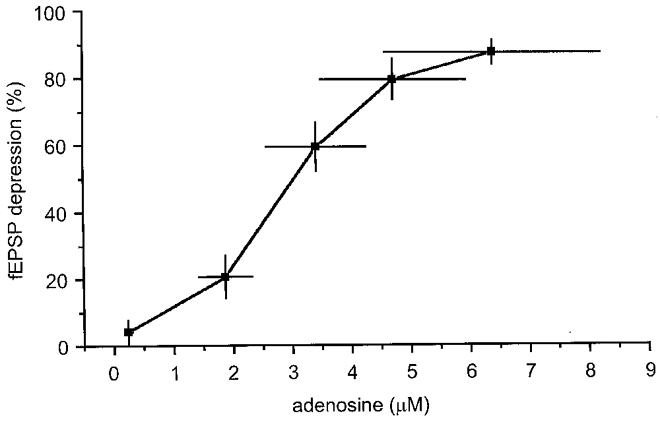
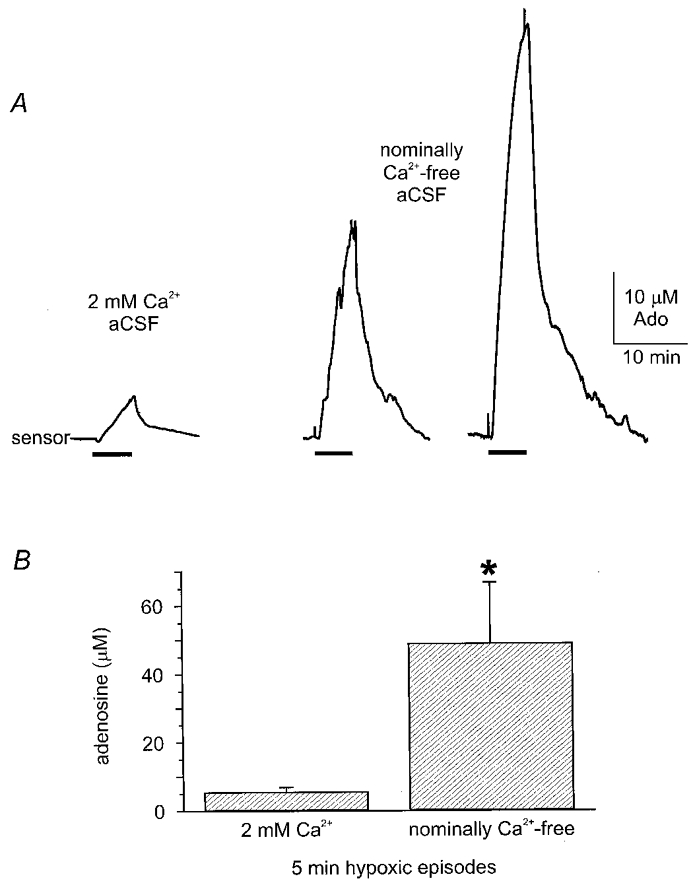
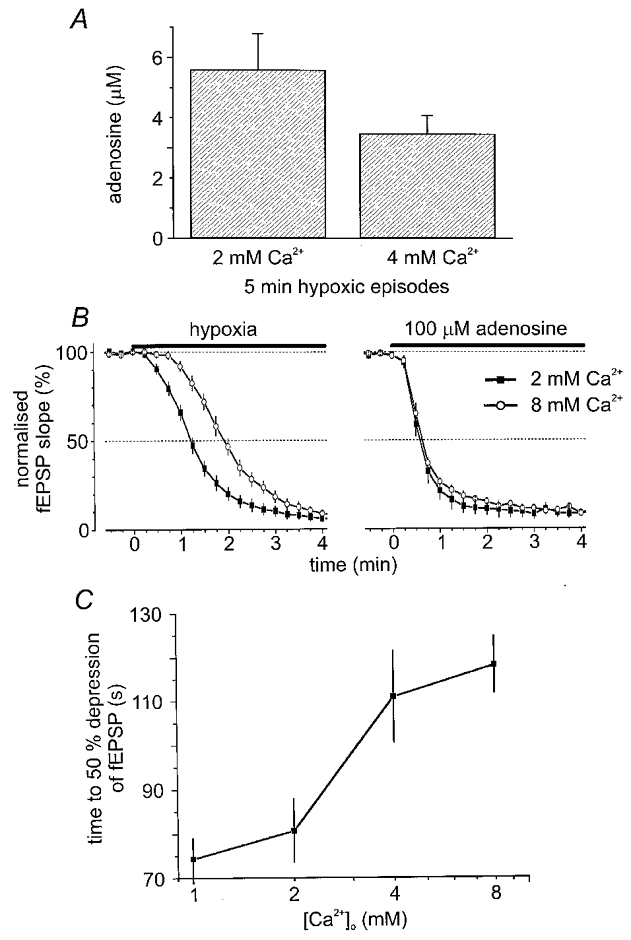
We have used an enzyme-based, twin-barrelled sensor to measure adenosine release during hypoxia in the CA1 region of rat hippocampal slices in conjunction with simultaneous extracellular field recordings of excitatory synaptic transmission. When loaded with a combination of adenosine deaminase, nucleoside phosphorylase and xanthine oxidase, the sensor responded linearly to exogenous adenosine over the concentration range 10 nM to 20 microM. Without enzymes, the sensor when placed on the surface of hippocampal slices recorded a very small net signal during hypoxia of 40 +/- 43 pA (mean +/- s.e.m.; n = 7). Only when one barrel was loaded with the complete sequence of enzymes and the other with the last two in the cascade did the sensor record a large net difference signal during hypoxia (1226 +/- 423 pA; n = 7). This signal increased progressively during the hypoxic episode, scaled with the hypoxic depression of the simultaneously recorded field excitatory postsynaptic potential and was greatly reduced (67 +/- 6.5 %; n = 9) by coformycin (0.5-2 microM), a selective inhibitor of adenosine deaminase, the first enzyme in the enzymic cascade within the sensor. For 5 min hypoxic episodes, the sensor recorded a peak concentration of adenosine of 5.6 +/- 1.2 microM (n = 16) with an IC(50) for the depression of transmission of approximately 3 microM. In slices pre-incubated for 3-6 h in nominally Ca(2+)-free artificial cerebrospinal fluid, 5 min of hypoxia resulted in an approximately 9-fold greater release of adenosine (48.9 +/- 17.7 microM; n = 6). High extracellular Ca(2+) (4 mM) both reduced the adenosine signal recorded by the sensor during hypoxia (3.5 +/- 0.6 microM; n = 4) and delayed the hypoxic depression of excitatory synaptic transmission.


Figures

Figure 1
Figure 1. Schematic representation of adenosine sensor and recording arrangement
A, the adenosine sensor consisted of two parallel tubes of semi-permeable glass (overall width ≈500 μm) each housing a 50 μm platinum (Pt) wire held at a potential of +650 mV. B, placement of stimulating and recording electrodes and adenosine sensor on the CA1 region of the hippocampal slice.
Figure 3
Figure 3. Absolute dependence of hypoxic adenosine signal on presence of enzymes and inhibition by coformycin
A, the sensor, filled with enzyme-free buffer, was placed on the surface of the slice. Hypoxia was induced for 5 min as indicated, in this and subsequent figures, by the black bar and upward deflections of chart event marker. Note the minimal effect of hypoxia on the sensor trace whilst hypoxia clearly reversibly depressed the simultaneously recorded fEPSP (periodic downward deflections every 15 s and inset traces which are averages of 4 consecutive fEPSPs taken at the times indicated by the short black bar). B, in the same slice, the sensor was loaded with the appropriate enzyme mixture and returned to the same position as that in A. Hypoxia induced a profound polarisation of the sensor which reversed on return to normoxia. The fEPSP was once again reversibly depressed. C, the application of the selective adenosine deaminase inhibitor, coformycin (1 μM), greatly attenuated the hypoxia-induced polarisation of the sensor.
Figure 2
Figure 2. Linearity of sensor to adenosine
A, concentration-dependent polarisations of sensor in response to exogenous adenosine (1.25-20 μM) applied for the duration shown by the black bar and between upward deflections of chart event marker. The selective adenosine deaminase inhibitor, coformycin (1 μM), greatly attenuated the adenosine-dependent polarisation. B, graph of the experiment depicted in A showing linearity of sensor to adenosine over the concentration range most commonly encountered in this study, with the effects of coformycin on the adenosine signal.
Figure 4
Figure 4. Dependence of hypoxic signal on adenosine deaminase
A, simultaneously recorded hypoxic signals recorded with symmetrical loading of sensor (nucleoside phosphorylase and xanthine oxidase in both barrels). Upper trace (single-ended) shows the output from one barrel whilst the lower trace (differential) shows the differential output between the two barrels. B, differential recording with adenosine deaminase loaded into one barrel. C, superimposition of differential traces with (plus AD) and without (minus AD, in grey) adenosine deaminase. D, coformycin (in grey) greatly reduced the differential signal. All traces taken from the same experiment.
Figure 5
Figure 5. Adenosine release during hypoxia
A, representative increase in extracellular adenosine during a 5 min hypoxic episode and reversible depression of fEPSP as indicated by the continuous chart trace and averages of four consecutive fEPSPs taken at times indicated by the short black bar under the chart trace. B, rise in extracellular adenosine during a 10 min exposure to hypoxia. Inset traces are averages of four consecutive fEPSPs (at 15 s intervals) taken at the times indicated by the letters a, b, c and d. The bottom graph shows the time course of the hypoxic depression of the averaged fEPSP synchronised with the start of the hypoxic episode. Note the close correlation between the increase in extracellular adenosine and the depression of the fEPSP. Scale bars refer to both A and B.
Figure 6
Figure 6. Relationship between the adenosine signal recorded by sensor and hypoxic depression of the simultaneously recorded fEPSP
Pooled data from eight experiments in which adenosine concentration (in micromolar) is plotted, at 1 min intervals, against the depression of the simultaneously recorded fEPSP during a 5 min episode. Note the sigmoidal relationship with an IC50 of approximately 3 μM. Horizontal and vertical bars represent 1 s.e.m.
Figure 7
Figure 7. Extracellular Ca2+ is not required for hypoxic adenosine release
A, three examples of hypoxic adenosine release from three separate experiments (5 min exposure). Left-most in 2 mM Ca2+-containing ACSF. Two traces on the right are from two separate experiments recorded from slices pre-incubated in nominally Ca2+-free ACSF (for 3-6 h). Note the massive increase in release of adenosine during hypoxia in nominally Ca2+-free ACSF. B, pooled data showing hypoxic adenosine release is significantly greater (P = 0.001, unpaired t test) in nominally Ca2+-free ACSF (n = 6) compared to 2 mM extracellular Ca2+ (n = 16).
Figure 8
Figure 8. Elevated extracellular Ca2+ inhibits adenosine release during hypoxia and slows the rate of depression of the fEPSP
A, sensor measurements of hypoxic adenosine release in 2 mM (n = 16) and 4 mM (n = 4) extracellular Ca2+ showing a trend for reduced adenosine release in high Ca2+. B, in a parallel series of experiments the effect of hypoxia and exogenous adenosine on synaptic transmission in different extracellular Ca2+ concentrations was examined. B left, at time zero hypoxia (black bar) was induced in 2 mM Ca2+ ACSF (filled symbols; n = 18) and 8 mM Ca2+ ACSF (open symbols; n = 7). Note the pronounced retardation in the rate of depression of the fEPSP. B right, in contrast, synaptic transmission was equally sensitive to exogenous adenosine (100 μM; black bar) in both 2 mM Ca2+ ACSF (filled symbols; n = 6) and 8 mM Ca2+ ACSF (open symbols; n = 5). C, concentration dependence of the effects of extracellular Ca2+ on the time to 50 % depression of the fEPSP (1 mM, n = 13; 2 mM, n = 18; 4 mM, n = 14; 8 mM, n = 7). In B and C fEPSPs measured approximately 1 mV.

References

    1. Anderson WW, Collingridge GL. A data acquisition program for on-line analysis of long-term potentiation and long-term depression. Society for Neuroscience Abstracts. 1997;23:665. - PubMed
    1. Arlinghaus L, Lee KS. Endogenous adenosine mediates the sustained inhibition of excitatory synaptic transmission during moderate hypoxia. Brain Research. 1996;724:265–268. - PubMed
    1. Belousov AB, Godfraind J-M, Krnjevic K. Internal Ca2+ stores involved in anoxic responses of rat hippocampal neurons. The Journal of Physiology. 1995;486:547–556. - PMC - PubMed
    1. Bischofberger N, Jacobson KA, Von Lubitz DK. Adenosine A1 receptor agonists as clinically viable agents for treatment of ischemic brain disorders. Annals of the New York Academy of Sciences. 1997;825:23–29. - PMC - PubMed
    1. Brundege JM, Dunwiddie TV. Role of adenosine as a modulator of synaptic activity in the central nervous system. Advances in Pharmacology. 1997;39:353–391. - PubMed

Publication types

MeSH terms

LinkOut - more resources