. 2000 Jul;106(1):117-24.
doi: 10.1172/JCI6218.

Potential mechanisms of human natural killer cell expansion in vivo during low-dose IL-2 therapy

Affiliations

Potential mechanisms of human natural killer cell expansion in vivo during low-dose IL-2 therapy

T A Fehniger et al. J Clin Invest. 2000 Jul.

Abstract

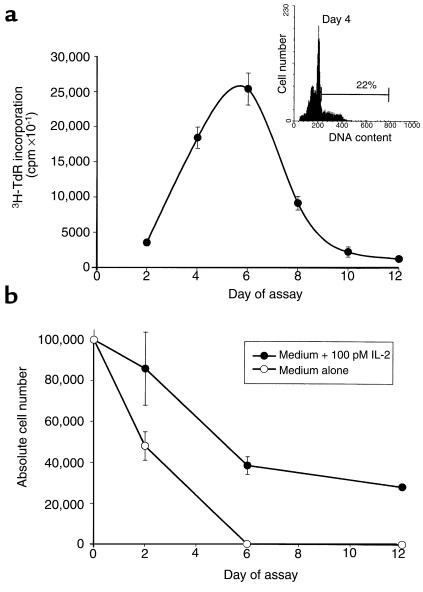
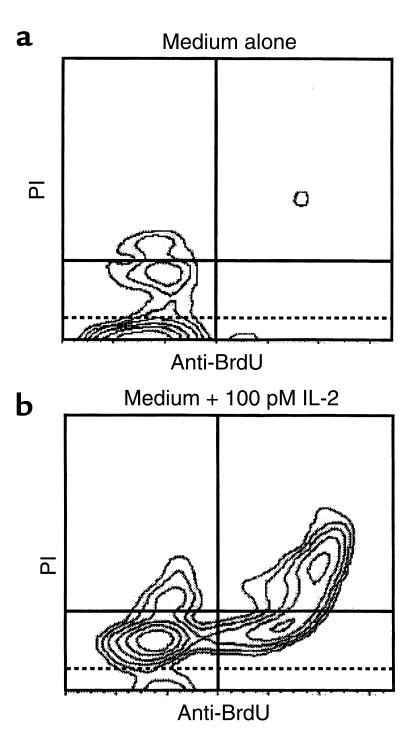
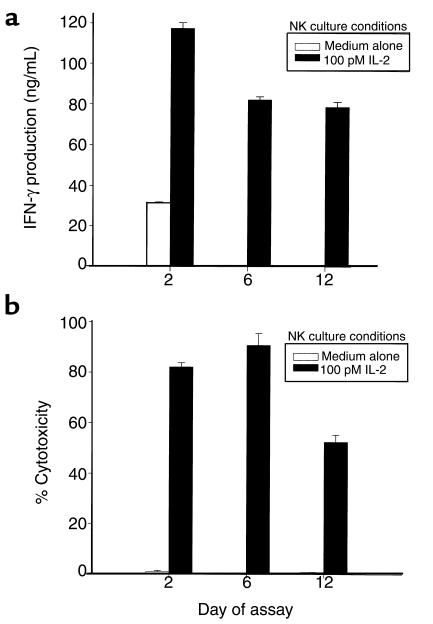
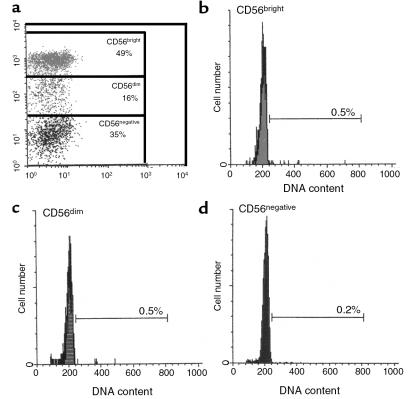
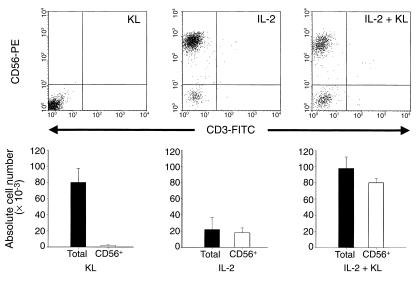
The continuous, in vivo infusion of low-dose IL-2 selectively expands the absolute number of human natural killer (NK) cells after 4-6 weeks of therapy. The mechanism responsible for this expansion is unknown and was examined in this study. NK cells cultured at low concentrations of IL-2, comparable to those found during in vivo therapy, proliferate for 6 days and then exit the cell cycle. However, NK cells in vivo did not traverse the S/G(2)/M phase of the cell cycle during low-dose IL-2 therapy. Low concentrations of IL-2 delay programmed cell death of NK cells but have the same effect on resting T cells that do not expand in vivo. When CD34(+) bone marrow hematopoietic progenitor cells are cultured for 21 days with low concentrations of IL-2, they differentiate into CD56(+)CD3(-) NK cells, not T cells. Thus, the selective expansion of human NK cells during continuous in vivo infusion of low-dose IL-2 likely results from enhanced NK-cell differentiation from bone marrow progenitors, combined with an IL-2-dependent delay in NK-cell death, rather than proliferation of mature NK cells in the periphery.


Figures

Figure 1
Figure 1
(a) 12-day 3H-TdR incorporation of CD56bright NK cells cultured in 100 pM rIL-2. Freshly isolated CD56bright NK cells (>97% pure) were plated in 96-well plates and cultured in medium containing 100 pM rIL-2, as described in Methods. Cells were assayed for 3H-TdR incorporation every 48 hours. Each time point represents the mean cpm ± SEM of triplicate wells. Inset: Histogram of Hoechst-stained CD56bright NK cells cultured for 4 days with medium containing 100 pM rIL-2. Cell number is measured along the ordinate, DNA content along the abscissa. Five thousand events were collected and analyzed. Number above the region marker (22%) indicates the percentage of cells in the G2/M phase of the cell cycle. Approximately 45% of cells were found in the hypodiploid region of the histogram, usually indicative of apoptosis. (b) Enumeration of CD56bright NK cells by vital dye exclusion during 12-day culture in medium supplemented with or without 100 pM rIL-2. Values shown represent the mean ± SEM of readings done in triplicate wells. This figure is representative of four independent experiments performed on sorted CD56bright cells from four normal individuals.
Figure 2
Figure 2
Correlation of apoptosis and proliferation of IL-2–stimulated CD56bright NK cells as evaluated by PI/BrdU assay. Shown are representative contour plots of sorted CD56bright NK cells cultured in the absence (a) or presence (b) of 100 pM IL-2 for 6 days and assayed as described in Methods. BrdU incorporation (proliferative activity) is measured along the abscissa (FITC fluorescence). PI fluorescent intensity (DNA content) is measured along the ordinate (red fluorescence). Cells that have undergone apoptosis show a hypodiploid complement of DNA and fall below the dashed horizontal divider. Normal (viable) diploid cells are found between the dashed and solid horizontal lines. In the absence of IL-2 (a), there is no evidence of BrdU incorporation, and the vast majority of CD56bright NK cells are found within the hypodiploid fraction by day 6. In the presence of IL-2 (b), a fraction of cells proliferate, incorporate BrdU, and are therefore seen to the right of the vertical divider. Apoptosis has only occurred within the nondividing fraction of cells (left, below dashed line). This is representative of three independent experiments with similar results.
Figure 3
Figure 3
CD56bright cells cultured in 100 pM IL-2 maintain functional capacity relative to culture in medium alone. (a) NK-cell production of IFN-γ in response to stimulation with IL-2 plus IL-12. Twenty thousand CD56bright cells per well were plated in the presence or absence of 100 pM IL-2. On days 2, 6, and 12, IL-2 (1 nM) and IL-12 (10 U/mL) were added, and 2 days later, the supernatants were collected and analyzed for IFN-γ by ELISA. Results depict the mean ± SEM for triplicate wells. (b) Cytotoxicity of CD56bright cells against K562 targets after 2, 6, or 12 days of culture with or without 100 pM rIL-2. Values given represent the mean ± SEM of readings from triplicate wells for each time point, at an effector-to-target ratio of 5:1. The data shown are representative of three independent experiments.
Figure 4
Figure 4
CD56bright cells expanding in vivo to IL-2 are not transiting the cell cycle. (a) Dot plot of a representative patient’s lymphocytes stained with anti–CD56-PE and analyzed by flow cytometry during low-dose IL-2 therapy. Percentages located within individual gated regions indicate the fraction each subset comprises as a percentage of total cells analyzed. PE fluorescent intensity is given along the ordinate, FITC fluorescent intensity along the abscissa. Hoechst cell-cycle analyses of CD56bright NK cells (b), CD56dim NK cells (c), and CD56negative, i.e., T and B cells (d) represented in a, are shown in the right column. Cell number is measured along the ordinate, DNA content along the abscissa. Percentages noted above the region markers of each subpopulation indicate the percentage of cells in the G2/M phase of the cell cycle. A summary of data for five patients during IL-2 therapy is found in Table 1.
Figure 5
Figure 5
Effect of low-dose IL-2, KL, or IL-2 plus KL on the development of NK cells from CD34+ HPCs. Upper panels show phenotypic evaluation of cells produced from 21-day culture of CD34+ HPCs with 100 pM IL-2, 7 nM KL, or a combination of both. Anti–CD3-FITC and anti–CD56-PE mAb’s that were subsequently analyzed by FACS are shown. Graphs below show absolute numbers of total mononuclear cells or CD56+ cells produced by CD34+ HPC cultures. Absolute numbers of CD56+ cells were obtained by multiplying absolute numbers of cells counted in trypan blue by percent CD56+ cells obtained by FACS. The data are representative of six separate experiments.

References

    1. Trinchieri G. Biology of natural killer cells. Adv Immunol. 1989;47:187–376. - PMC - PubMed
    1. Robertson MJ, Ritz J. Biology and clinical relevance of human natural killer cells. Blood. 1990;76:2421–2438. - PubMed
    1. Caligiuri MA, et al. Functional consequences of interleukin 2 receptor expression on resting human lymphocytes. Identification of a novel natural killer cell subset with high affinity receptors. J Exp Med. 1990;171:1509–1526. - PMC - PubMed
    1. Nagler A, Lanier LL, Phillips JH. Constitutive expression of high affinity interleukin 2 receptors on human CD16-natural killer cells in vivo. J Exp Med. 1990;171:1527–1533. - PMC - PubMed
    1. Caligiuri MA, et al. Selective modulation of human natural killer cells in vivo after prolonged infusion of low dose recombinant interleukin 2. J Clin Invest. 1993;91:123–132. - PMC - PubMed

Publication types