. 2000 Jul;157(1):43-50.
doi: 10.1016/S0002-9440(10)64515-4.

The role of intracellular calcium signaling in premature protease activation and the onset of pancreatitis

Affiliations

The role of intracellular calcium signaling in premature protease activation and the onset of pancreatitis

B Krüger et al. Am J Pathol. 2000 Jul.

Abstract

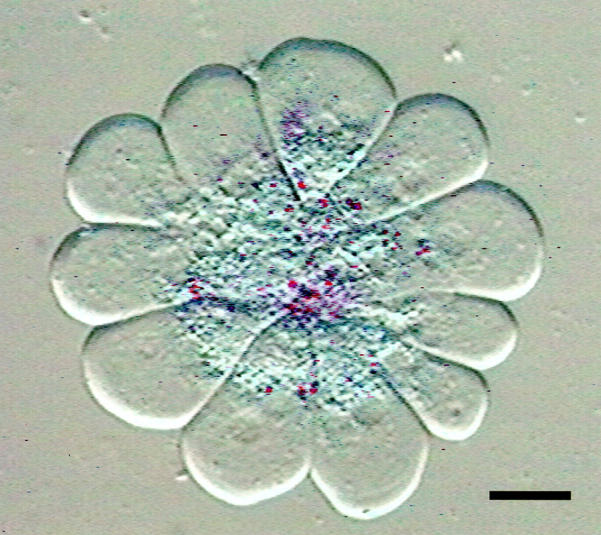
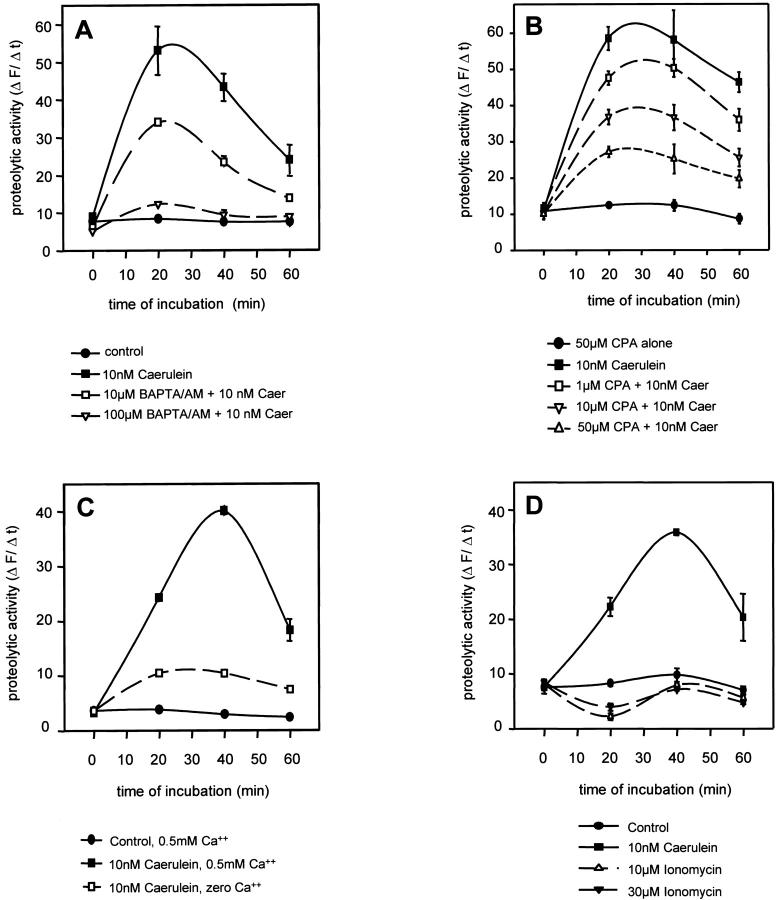
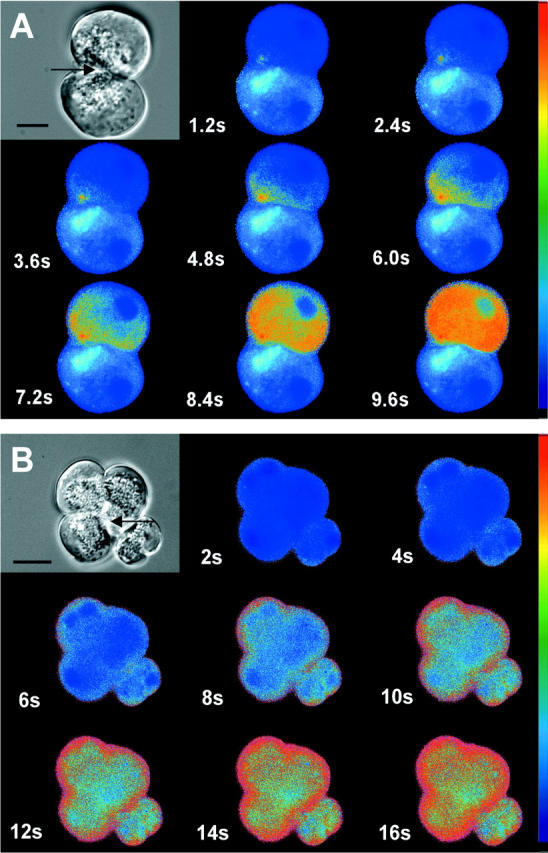
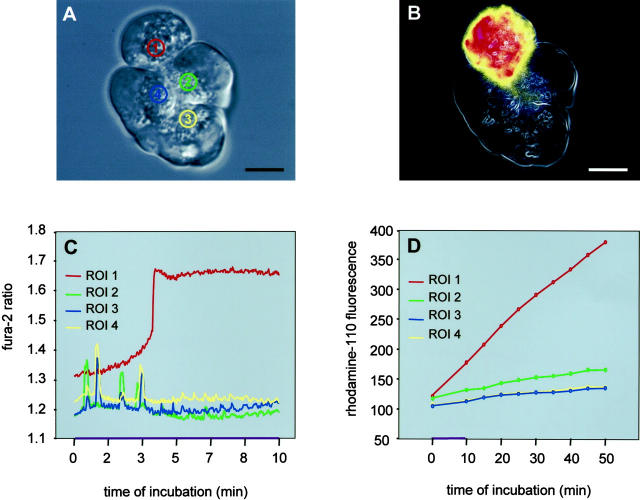
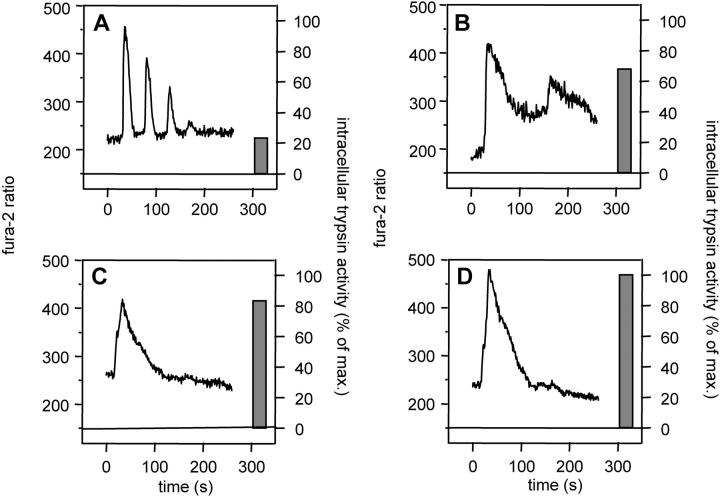
The exocrine pancreas synthesizes and secretes large amounts of digestive proteases as inactive precursor zymogens. Under physiological conditions a variety of cellular defense mechanisms protect the pancreatic acinar cell against a premature and intracellular activation of these zymogens. When these defenses fail, pancreatic autodigestion is initiated and acute pancreatitis can develop. A number of experimental observations suggest that extra- as well as intracellular calcium concentrations play an important part in the initiation of pancreatic protease activation, but the intracellular signaling events that regulate this process are unknown. Using a model system in which we used pancreatic acini (freshly prepared functional units of living acinar cells), we were able to simulate the conditions found during experimental pancreatitis in rodents. By means of a cell permeant fluorescent trypsin substrate we could demonstrate in these acini that premature protease activation is initiated at the apical acinar cell pole and occurs only in the presence of secretagogue concentrations that exceed those required for a maximum secretory response. By combining this technique with fluorescence ratio imaging for the Ca(2+)-sensitive dye fura-2, we could further show that this protease activation is highly dependent on the spatial as well as the temporal distribution of the corresponding Ca(2+) release from stores within the same subcellular compartment and that it is not propagated to neighboring acinar cells.


Figures

Figure 1.
Figure 1.
Digital fluorescence micrograph superimposed on the differential interference contrast (DIC) image of a living pancreatic acinus 10 minutes after stimulation with a supramaximum concentration of cerulein (10 nmol/L) and 30 minutes after subsequent addition of the substrate. At this time interval the bright focal fluorescence (pseudocolor red for better contrast) that corresponds to the site of cleavage of the trypsin substrate (CBZ-Ile-Pro-Arg)2-rhodamine-110 remains strictly confined to the secretory vesicle-containing compartment in the apical portion of the acinar cells. Note that the acinus was placed under a coverslip to allow a better optical resolution of intracellular structures. Scale bar, 10 μm.
Figure 2.
Figure 2.
Cleavage of the cell-permeant fluorogenic trypsin substrate (CBZ-Ile-Pro-Arg)2-rhodamine-110 and the corresponding release of rhodamine-110 fluorescence were quantified by cytofluorometry of living cells (Ex 485 nm, Em 530 nm) as described in Materials and Methods. A: Five-minute preincubation with the Ca2+ chelator BAPTA-AM reduced the subsequent, secretagogue-induced (10 nmol/L cerulein) activation of intracellular trypsinogen in a concentration-dependent manner. B: Incubation of acini with the Ca2+-ATPase inhibitor cyclopiazonic acid (CPA 50 μmol/L). When given alone CPA induces a rapid increase in intracellular Ca2+ but does not increase intracellular trypsin activity. When acini were preincubated with CPA for 5 minutes to ultimately deplete intracellular Ca2+ stores and supramaximum cerulein (10 nmol/L) was added thereafter, the secretagogue-induced trypsin activation decreased in a CPA-concentration-dependent manner. C: The same inhibitory effect could be obtained by incubating acini in nominally Ca2+-free medium. D: The addition of the Ca2+ ionophore ionomycin, which rapidly increases intracellular Ca2+ concentrations, had no effect, as seen with CPA, on intracellular trypsinogen activation.
Figure 3.
Figure 3.
Acini were loaded with the Ca2+-sensitive dye fura-2 (2 μmol/L) for 30 minutes and exposed to either supramaximum concentrations of cerulein (10 nmol/L, A) or to the Ca2+ ionophore ionomycin (30 μmol/L, B). Intracellular Ca2+ concentrations were recorded as fura-2 fluorescence (Ex1 340 nm/Ex2 380 nm, Em 510 nm) and visualized by fluorescence microscopy. Note that under secretagogue stimulation the fluorescent signal was initiated at the apical pole of the acinar cell (arrows), whereas the ionophore treatment induced an increase in Ca2+ fluorescence that began at the basolateral aspect of the acinus. Top left panels represent transmission images of the respective acini. Scale bars, 10 μm.
Figure 4.
Figure 4.
Time course of the calcium release (C) and of the corresponding and subsequent protease activation (D) in the four regions of interest denoted in the differential interference contrast image of the acinus in A. After supramaximum cerulein stimulation (10 nmol/L) microfluorometric measurements in all four regions of interest were carried out for fura-2 fluorescence (Ex1 340 nm/Ex2 380 nm, Em 510 nm) and protease activation [(CBZ-Ile-Pro-Arg)2-rhodamine-110, 10 μM; Ex 485 nm, Em 530 nm] simultaneously. These parallel measurements indicate that only in the region of interest 1, where Ca2+ is released in a peak-plateau-like manner—and not in the regions of interest 2–4, in which Ca2+ is released in an oscillatory pattern—a subsequent trypsinogen activation can be observed. In B the same acinus is shown as a pseudocolor fluorescence image 25 minutes after exposure to supramaximum cerulein, and at this time interval the rhodamine-110 fluorescence has spread from the apical region of interest 1 to the entire cytosol of the affected cell. The neighboring cells containing the regions of interest 2–4 show no substrate cleavage. Scale bar, 10 μm.
Figure 5.
Figure 5.
Representative patterns of calcium release (curves at left of panels) and the corresponding protease activation (bars at right of panels) in apical regions of interest from individual acinar cells. Note that all different Ca2+ patterns were observed in response to supramaximal concentrations of cerulein (10 nmol/L). Short repetitive Ca2+ oscillations (A) were not followed by significant trypsinogen activation, whereas prolonged oscillations (B) or a sustained Ca2+ release (C and D) was followed by extensive intracellular protease activation irrespective of the magnitude of the fura-2 ratio. Note that intracellular trypsin activity is shown as a percentage of the maximum activatable trypsin activity in living cells in response to cerulein (10 nmol/L).

References

    1. Geokas MC, Largman C, Durie PR, Brodrick JW, Ray SB, O’Rourke M, Vollmer J: Immunoreactive forms of cationic trypsin in plasma and ascitic fluid of dogs in experimental pancreatitis. Am J Pathol 1981, 105:31-39 - PMC - PubMed
    1. Chiari H: Über die Selbstverdauung des menschlichen Pankreas. Z Heilk 1896, 17:69-96
    1. Whitcomb DC: Early trypsinogen activation in acute pancreatitis. Gastroenterology 1999, 116:770-772 - PubMed
    1. Mithofer K, Fernandez-del Castillo C, Frick TW, Lewandrowski KB, Rattner DW, Warshaw AL: Acute hypercalcemia causes acute pancreatitis and ectopic trypsinogen activation in the rat. Gastroenterology 1995, 109:239–246 - PubMed
    1. Ward JB, Peterson OH, Jenkins SA, Sutton R: Is an elevated concentration of acinar cytosolic free ionised calcium the trigger for acute pancreatitis? Lancet 1995, 346:1016-1019 - PubMed

Publication types