. 2000 Jul;157(1):221-36.
doi: 10.1016/S0002-9440(10)64533-6.

Disruption of redox homeostasis in tumor necrosis factor-induced apoptosis in a murine hepatocyte cell line

Affiliations

Disruption of redox homeostasis in tumor necrosis factor-induced apoptosis in a murine hepatocyte cell line

R H Pierce et al. Am J Pathol. 2000 Jul.

Abstract

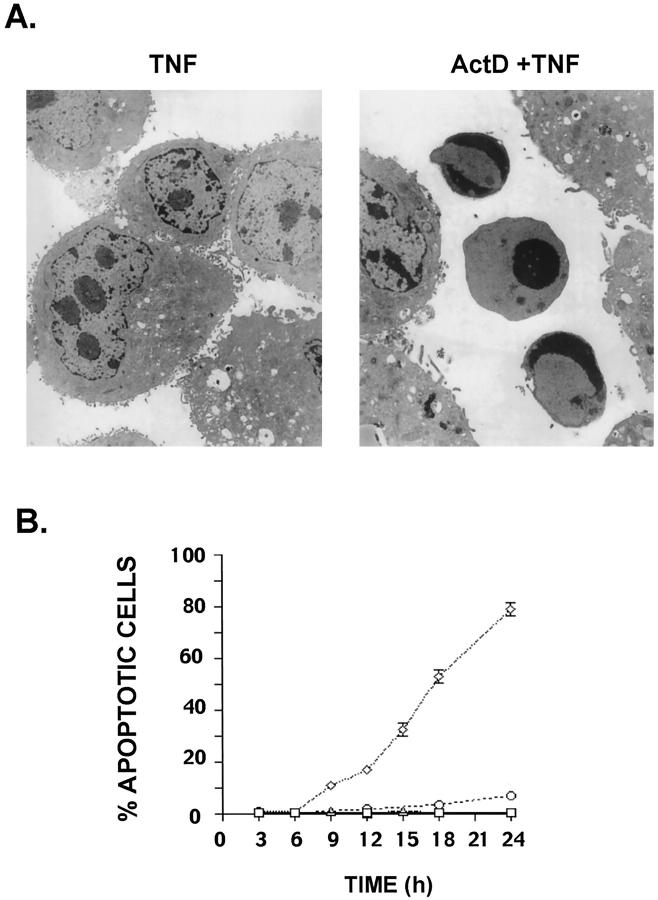
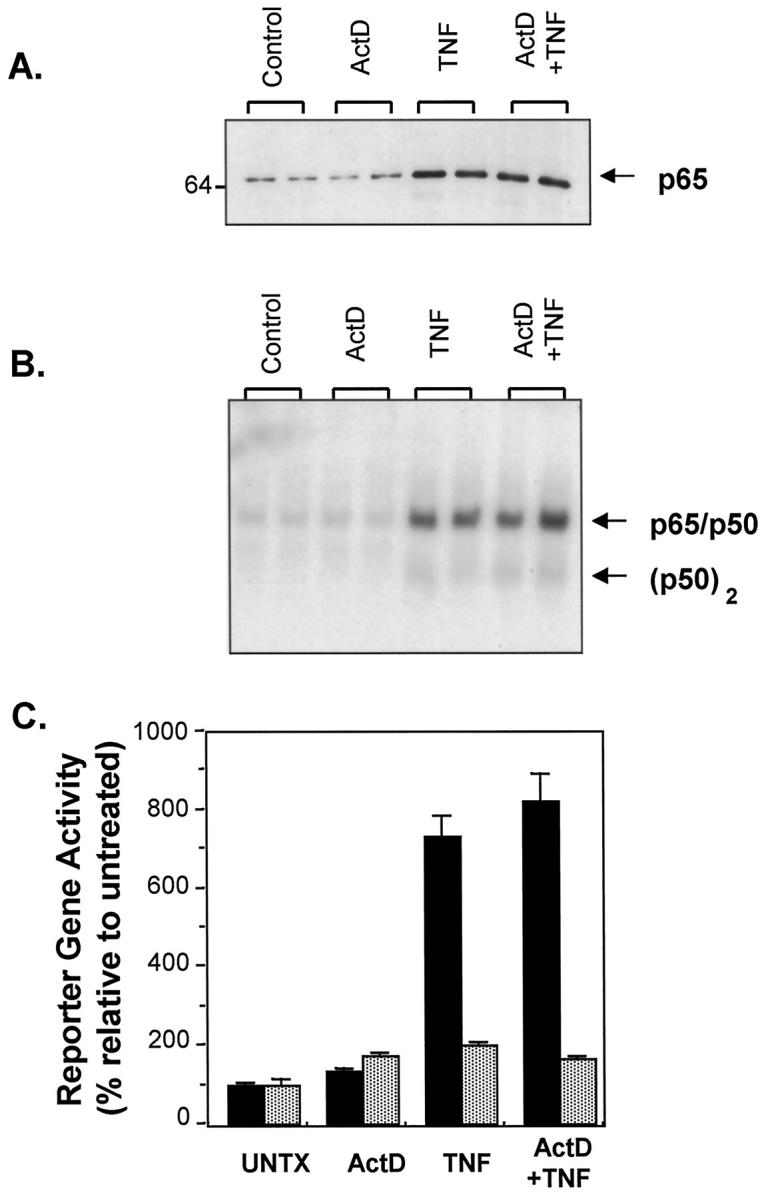
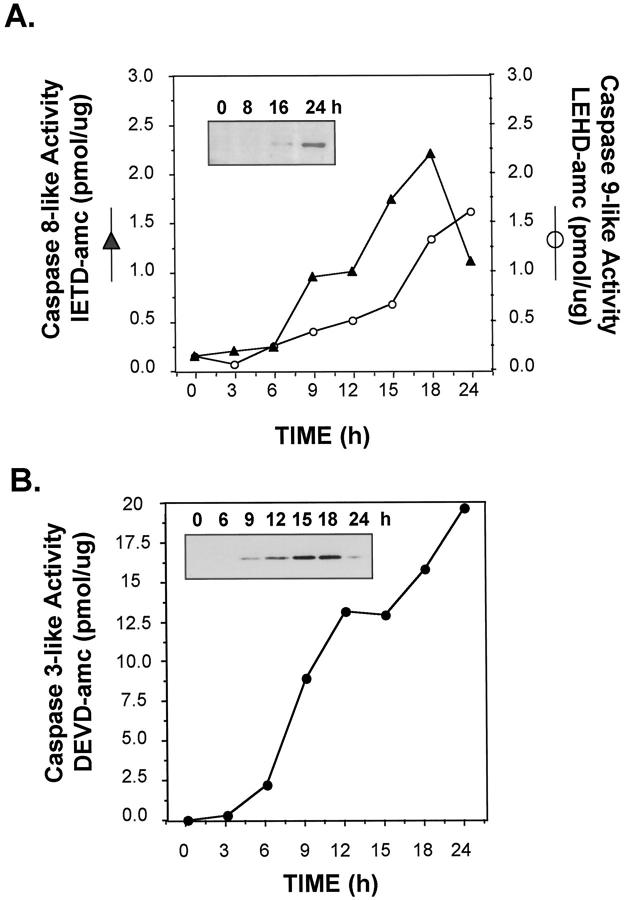
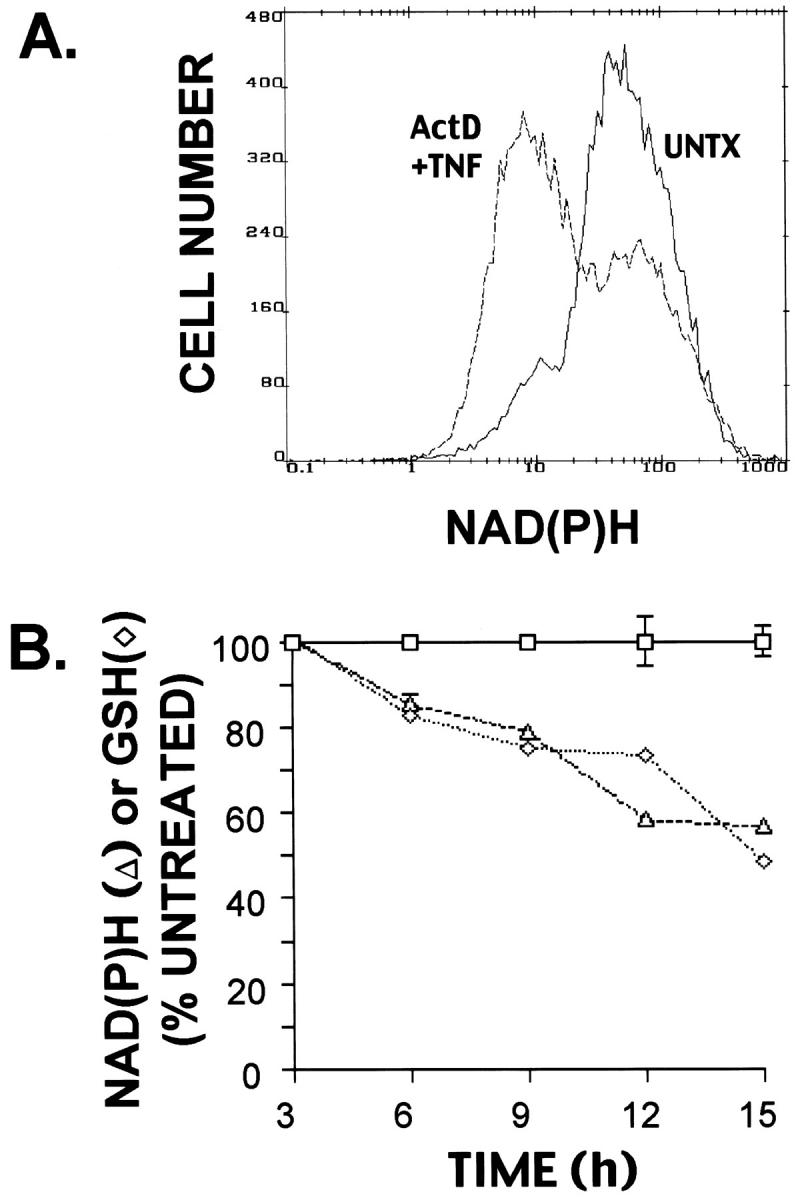
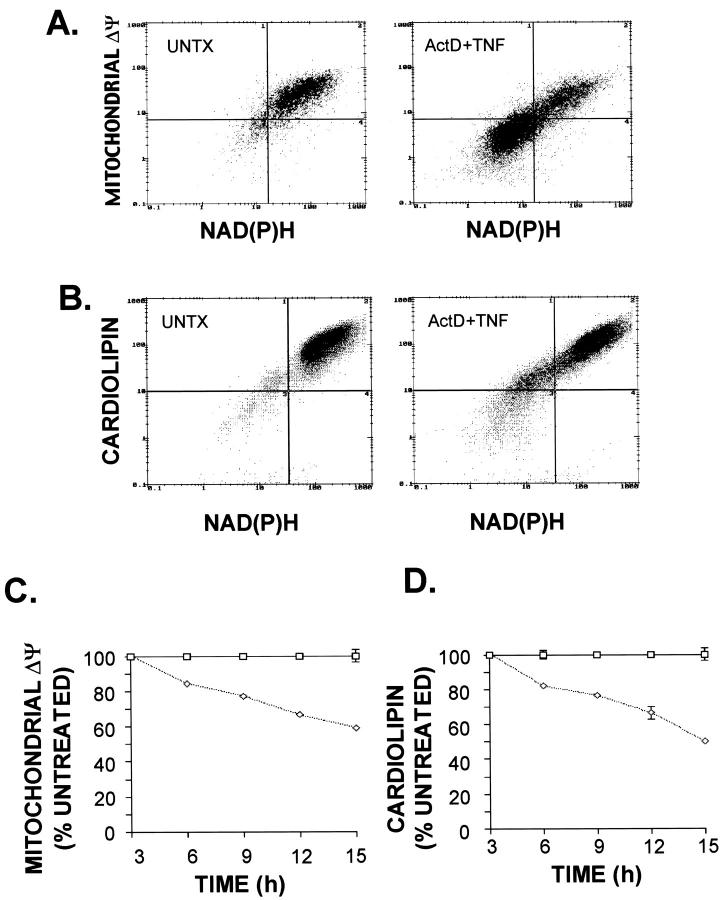
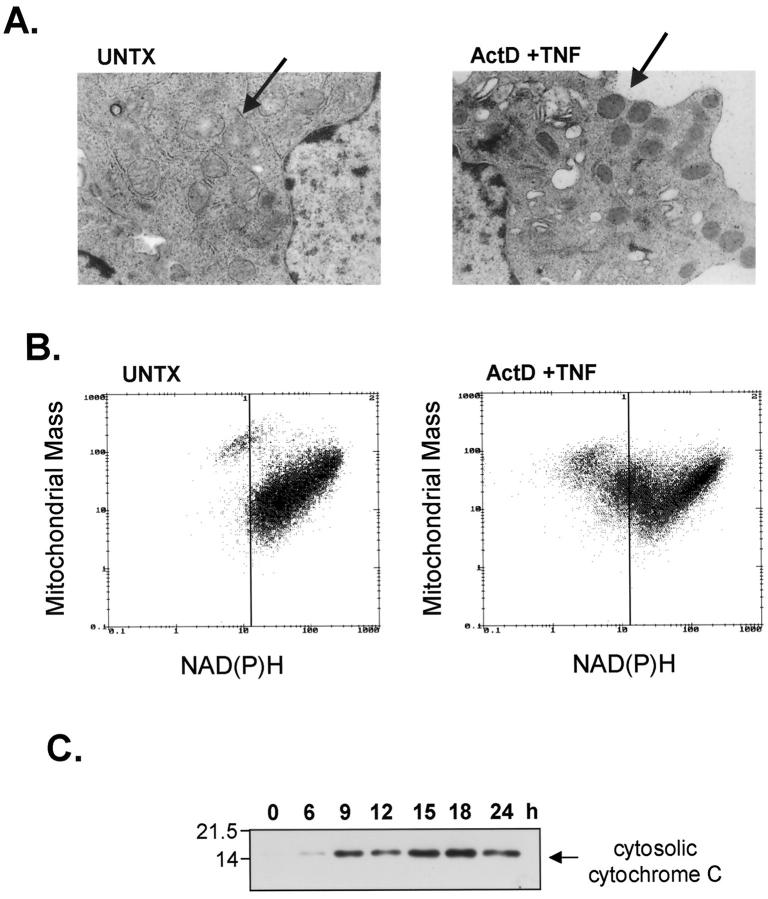
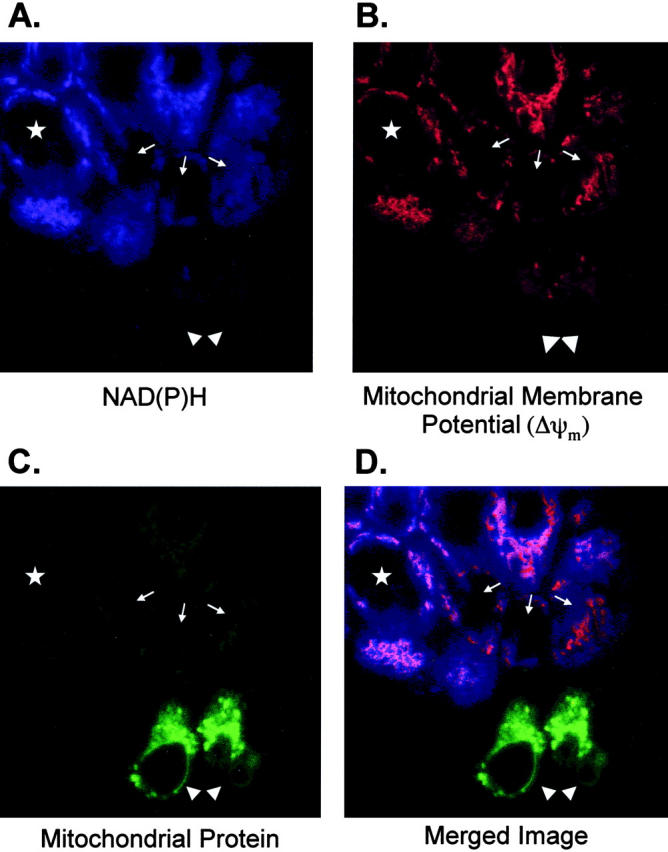
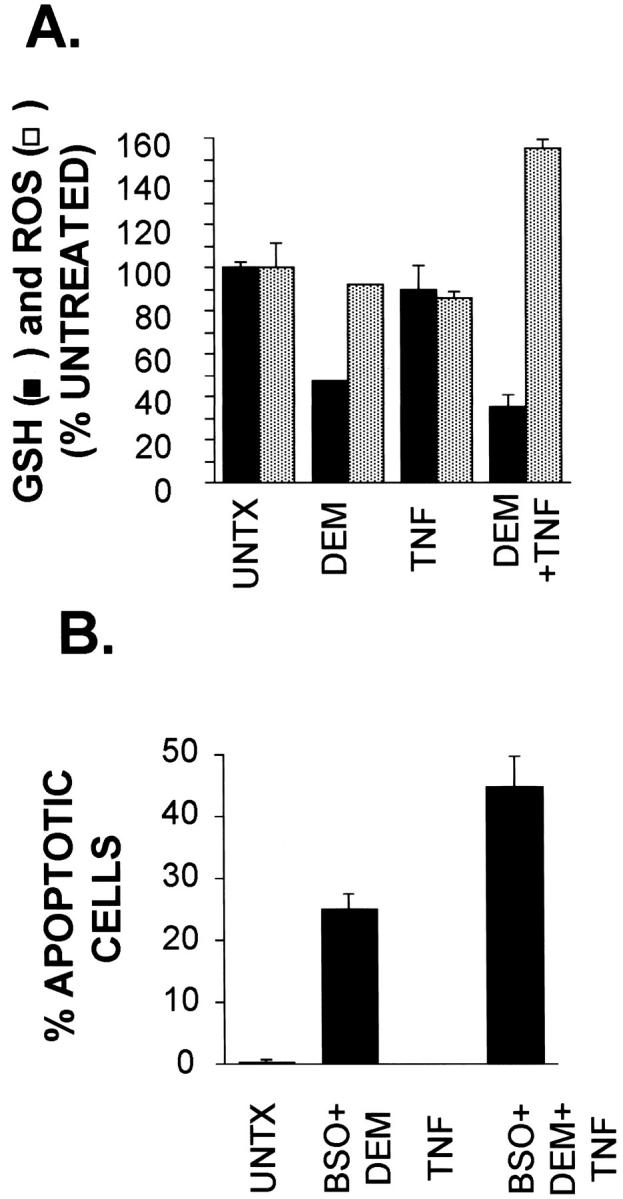
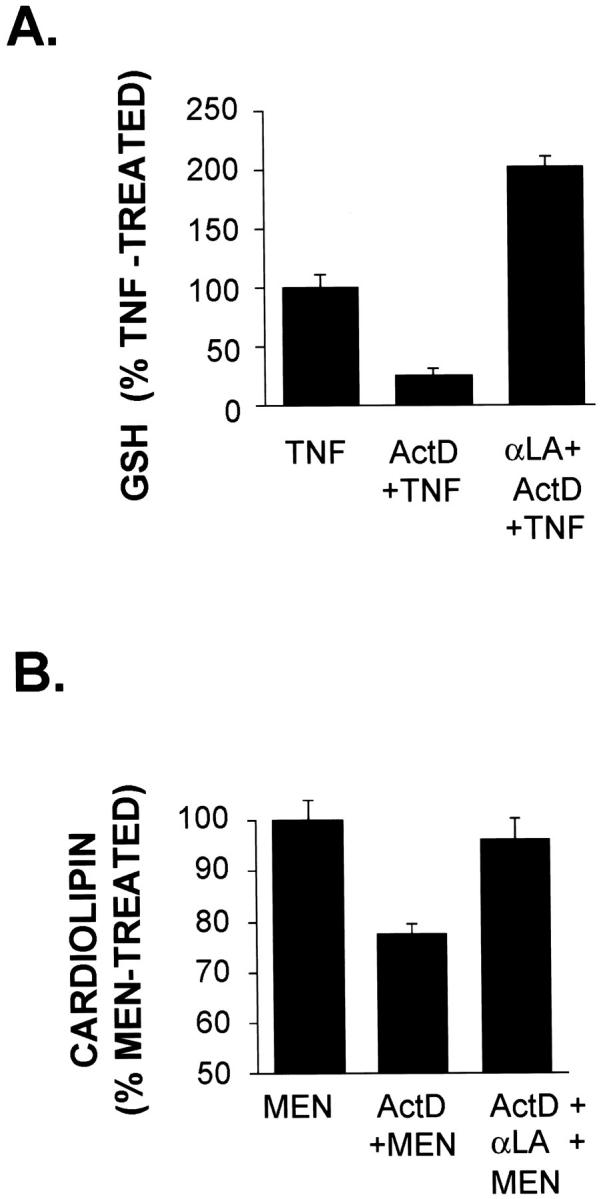
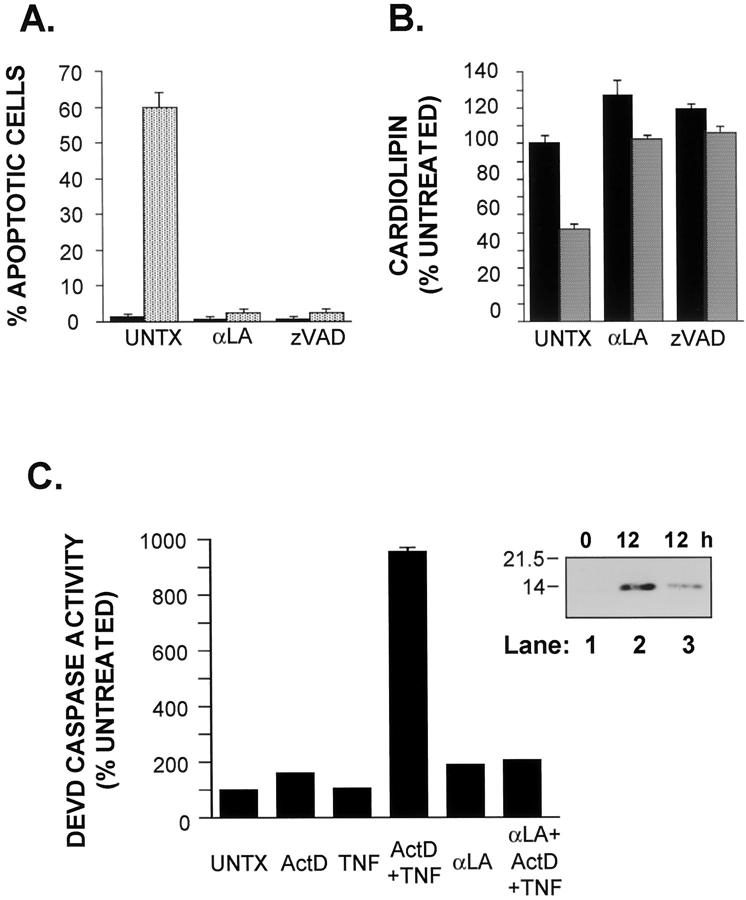
Tumor necrosis factor (TNF) is a mediator of the acute phase response in the liver and can initiate proliferation and cause cell death in hepatocytes. We investigated the mechanisms by which TNF causes apoptosis in hepatocytes focusing on the role of oxidative stress, antioxidant defenses, and mitochondrial damage. The studies were conducted in cultured AML12 cells, a line of differentiated murine hepatocytes. As is the case for hepatocytes in vivo, AML12 cells were not sensitive to cell death by TNF alone, but died by apoptosis when exposed to TNF and a small dose of actinomycin D (Act D). Morphological signs of apoptosis were not detected until 6 hours after the treatment and by 18 hours approximately 50% of the cells had died. Exposure of the cells to TNF+Act D did not block NFkappaB nuclear translocation, DNA binding, or its overall transactivation capacity. Induction of apoptosis was characterized by oxidative stress indicated by the loss of NAD(P)H and glutathione followed by mitochondrial damage that included loss of mitochondrial membrane potential, inner membrane structural damage, and mitochondrial condensation. These changes coincided with cytochrome C release and the activation of caspases-8, -9, and -3. TNF-induced apoptosis was dependent on glutathione levels. In cells with decreased levels of glutathione, TNF by itself in the absence of transcriptional blocking acted as an apoptotic agent. Conversely, the antioxidant alpha-lipoic acid, that protected against the loss of glutathione in cells exposed to TNF+Act D completely prevented mitochondrial damage, caspase activation, cytochrome C release, and apoptosis. The results demonstrate that apoptosis induced by TNF+Act D in AML12 cells involves oxidative injury and mitochondrial damage. As injury was regulated to a larger extent by the glutathione content of the cells, we suggest that the combination of TNF+Act D causes apoptosis because Act D blocks the transcription of genes required for antioxidant defenses.


Figures

Figure 1.
Figure 1.
Apoptosis in AML12 cells exposed to TNF+Act D. Cells were pretreated with Act D (200 nmol/L) or saline (control) for 30 minutes and then TNF (20ng/ml) or PBS was added for the indicated times. A: After 15 hours of the indicated treatment, the cells were fixed and prepared for transmission electron microscopy as described in Materials and Methods (left panel, TNF treated; right panel, TNF+Act D). B: Cells were fixed in 70% ETOH at the indicated time points and apoptotic nuclear morphology was visualized by DAPI fluorescence. The percentage of apoptotic cells was measured in four treatment groups: saline and PBS (squares), Act D alone (circles), TNF alone (triangles), or TNF+Act D (diamonds). Each point was determined in triplicate and the error bars represent SEM. The results are representative of at least five independent experiments.
Figure 2.
Figure 2.
Analysis of NFκB activation and transcriptional activity. A and B: Cells were pretreated for 30 minutes with Act D (200 nmol/L) or saline followed by TNF (20 ng/ml). Nuclear extracts were prepared as described in Materials and Methods. A: Nuclear accumulation of p65 was assessed by immunoblot analysis. Duplicate samples of nuclear extracts (10 μg) were analyzed for p65 protein after 30 minutes of TNF treatment. Molecular weight markers indicated on the left. B: EMSA for NFκB after 30 minutes of exposure to TNF were carried out as described in Materials and Methods. The upper band (NFκB) consists of the p65/p50 heterodimer; the lower band is the p50/p50 homodimer. Duplicate samples are shown. These results are representative of three independent experiments. C: NFκB activation after TNF+Act D treatment was analyzed by a luciferase reporter gene. Cells were cotransfected with CMV β-galactosidase and NFκB-driven luciferase reporter constructs using lipofectamine, as described in Materials and Methods. After 5 hours, TNF+Act D was added for 9 hours as described in Materials and Methods. Cells were harvested and aliquots of protein lysate were assayed sequentially for both luciferase (black bars) and β-galactosidase activity (stippled bars). The bars depict SEM from six independent samples relative to untreated cells (UNTX).
Figure 3.
Figure 3.
Activation of caspase-3, -8, and -9 in AML12 cells treated with TNF+Act D. Cells were pretreated for 30 minutes with Act D (200 nmol/L) followed by stimulation with TNF (20 ng/ml). Cellular extracts were prepared and protein concentrations were determined as described in Materials and Methods. A: Caspase-8 and caspase-9 activities were determined on protein lysates using IETD-AMC (filled triangles) and LEHD-AMC (open circles), respectively. Inset: Immunoblot analysis on the appearance of the cleaved, active form of caspase-8 at the indicated times after treatment of TNF+Act D. B: Caspase-3 activity was determined on protein lysates using DEVD-AMC. Inset: Immunoblot analysis on the appearance of the cleaved, active form of caspase-3 at the indicated times after treatment with TNF+Act D. Each data point represents the average of duplicate samples. These data are representative of three independent experiments.
Figure 4.
Figure 4.
Loss of NAD(P)H and GSH levels in cells undergoing apoptosis. Cells were treated with TNF+Act D or saline (UNTX) and harvested for flow cytometry as described in Materials and Methods. A: Univariant NAD(P)H histogram for UNTX cells and cells treated for 12 hours with TNF+Act D. Total cellular reduced NAD (labeled as NAD(P)H to reflect contributions of from both NADH and NADPH) was measured as UV-excited blue autofluorescence (450 nm). Note that median fluorescence as well as the percent of the cells that remain within normal range can be derived from these curves. B: Time course of the coordinate loss of NAD(P)H and GSH is shown. NAD(P)H was determined by UV-excited blue fluorescence at 450 nm. GSH was measured by staining with MCB. Data points represent the percentage of cells that retain normal NAD(P)H (open triangles) or GSH (open diamonds) levels relative to the corresponding values obtained for the untreated samples (open squares). Error bars represent SEM from three independent samples. These data are representative of at least three independent experiments.
Figure 5.
Figure 5.
Loss of mitochondrial membrane potential and mitochondrial cardiolipin in cells undergoing apoptosis. Cells were treated with TNF+Act D and harvested for flow cytometry analysis as described in Materials and Methods. A: Bivariate dot-plots of membrane potential (ΔΨm, measured by CMX staining) and NAD(P)H from untreated (UNTX) cultures and cultures treated for 12 hours with TNF+Act D. B: Bivariate dot-plots of cardiolipin content (NAO staining) and NAD(P)H from untreated (UNTX) cultures and cultures treated for 12 hours with TNF+Act D. C and D: Time course of the progressive loss of mitochondrial membrane potential (C) and cardiolipin content (D) after TNF+Act D exposure. The exposure time is indicated on the abscissa. Data points represent the mean of the percent of cells that retain normal mitochondrial membrane potential (C) or cardiolipin content (D). Levels were calculated relative to untreated samples (open squares). Error bars represent SEM from three independent samples. These data are representative of at least three independent experiments.
Figure 6.
Figure 6.
Changes in mitochondrial mass and release of cytochrome C in cells undergoing apoptosis. Cells were treated with TNF+Act D and harvested at 12 hours for transmission electron microscopy, flow cytometry, and immunoblot analysis as described in Materials and Methods. A: Mitochondrial condensation as detected by transmission electron microscopy. Electron micrographs from UNTX- and TNF+Act D-treated cells (×12,000). The arrow indicates normal mitochondria with visible cristae and normal matrix density in UNTX samples. In the treated samples, the arrow indicates condensed mitochondria with increased electron density that obscures the cristae structure. B: Bivariate dot-plots of mitochondrial protein (MTG staining) and NAD(P)H from untreated (UNTX) cultures or cultures exposed to TNF+Act D. C: Time course of the release of cytosolic cytochrome C after treatment with TNF+Act D. Molecular weight markers are indicated on the left.
Figure 7.
Figure 7.
Confocal imaging of AML12 cells undergoing apoptosis. Cells were grown on coverslips and NAD(P)H fluorescence (A), mitochondrial membrane potential (CMX staining) (B), and mitochondrial mass (MTG) (C) were examined as described in Materials and Methods. A single field is shown in A–C and the images were merged in (D). The field displayed represents the spectrum of changes observed from early to late apoptosis: apparently normal cells (star); cells with decrease NAD(P)H but normal ΔΨm (arrows); frankly apoptotic cells (arrowheads).
Figure 8.
Figure 8.
ROS detection and TNF-induced apoptosis in cells with low GSH content. A: TNF-induced production of ROS in hepatocytes with low GSH. Cultures were untreated, treated with DEM (0.8 mmol/L), TNF (20 ng/ml), or both DEM and TNF. DEM exposure was for 60 minutes before TNF addition. Cells were harvested 18 hours later for flow cytometry using MCB staining (for GSH) and H2-CMXROS (for measuring ROS). The data are expressed relative to values of untreated samples (UNTX). Error bars represent SEM of triplicate samples. B: TNF promotes apoptosis in cells with low GSH. Cultures were left untreated (UNTX) or were treated with TNF (20 ng/ml), BSO (1 mmol/L) + DEM (0.8 mmol/L), or with a combination of BSO+DEM+TNF. Exposure to BSO and DEM started 60 minutes and 30 minutes, respectively, before TNF treatment. Cells were harvested 19 hours later, fixed in 70% ethanol after trypsinization, and stained with DAPI for fluorescence microscopy analysis. Error bars represent SEM from triplicate samples. Data shown are representative of at least three independent experiments.
Figure 9.
Figure 9.
α-Lipoic acid increases GSH levels and prevents injury from oxidative agents. A: α-LA blocks the loss of GSH induced by TNF+Act D. Cells were treated with TNF, TNF+Act D, or pretreated with 1 mmol/L α-LA for 60 minutes before the addition of TNF (20 ng/ml) plus Act D (200 nmol/L). After a 12-hour incubation, cells were harvested and cellular GSH content was assessed by flow cytometry using MCB staining as described in Materials and Methods. Error bars represent SEM from triplicate samples. B: Act D potentiates cardiolipin loss. Cells were pretreated with Act D (200 nmol/L) alone or together with α-LA (1 mmol/L) for 9 hours. MEN (100 μmol/L) was then added for 3 hours. Cells were harvested and mitochondrial cardiolipin was assessed by flow cytometry using NAO staining as described in Materials and Methods. The error bars represent SEM of triplicate samples relative to menadione-treated cells. MEN treatment resulted in minimal loss of cardiolipin. Data shown are representative of at least three independent experiments.
Figure 10.
Figure 10.
α-LA and a caspase inhibitor block TNF-induced mitochondrial injury and apoptosis. Cells were pretreated with zVAD-FMK (100 μmol/L) for 3 hours or α-LA (1 mmol/L) for 1 hour before the addition of TNF+Act D as described in Materials and Methods. A: Both α-LA and zVAD-FMK block apoptosis induced by TNF+Act D treatment. Cells were harvested 18 hours after the addition of TNF, fixed in 70% ETOH, and stained with DAPI as described in Materials and Methods. Error bars represent SEM of triplicate plates. UNTX, black bars and TNF+Act D treated, stippled bars. B: Both α-LA and zVAD-FMK block loss of cardiolipin induced by TNF+Act D treatment. Cells were harvested 12 hours after the addition of TNF and analyzed by flow cytometry using NAO staining as described in Materials and Methods. Error bars represent SEM of triplicate plates. UNTX, black bars and TNF+Act D treated, stippled bars. Values are normalized to UNTX samples. C: Both α-LA and zVAD-FMK block caspase-3 activity induced by TNF+Act D treatment. Cells were harvested 15 hours after the addition of TNF and analyzed for caspase-3 activity as described in Materials and Methods. Error bars represent SEM of triplicate plates. Values are normalized to untreated samples. Data shown are representative of at least three independent experiments. Inset: TNF+Act D-induced cytosolic cytochrome C release is blocked by α-LA. Cells were harvested 12 hours after the addition of TNF and release of cytosolic cytochrome C was detected by immunoblot analysis as described in Materials and Methods. Protein from untreated cells, cells treated with TNF+Act D for 12 hours, and cells pretreated with α-LA and then treated with TNF+Act D for 12 hours are shown in lanes 1, 2, and 3, respectively.

Similar articles

Cited by

References

    1. Ashkenazi A, Dixit VM: Death receptors: signaling and modulation. Science 1998, 281:1305-1308 - PubMed
    1. Wallach D, Boldin M, Varfolomeev E, Beyaert R, Vandenabeele P, Fiers W: Cell death induction by receptors of the TNF family: towards a molecular understanding. FEBS Lett 1997, 410:96-106 - PubMed
    1. Arch RH, Gedrich RW, Thompson CB: Tumor necrosis factor receptor-associated factors (TRAFs): a family of adapter proteins that regulates life and death. Genes Dev 1998, 12:2821-2830 - PubMed
    1. Ghosh S, May MJ, Kopp EB. NFκB and Rel proteins: evolutionarily conserved mediators of immune responses. Annu Rev Immunol 1998, 16:225–260 - PubMed
    1. Hsu H, Xiong J, Goeddel D: The TNF receptor 1-associated protein TRADD signals cell death and NFκB activation. Cell 1995, 81:495-504 - PubMed

Publication types

MeSH terms