. 2000 Jul 3;19(13):3337-48.
doi: 10.1093/emboj/19.13.3337.

Constitutive activation of NF-kappaB and T-cell leukemia/lymphoma in Notch3 transgenic mice

Affiliations

Constitutive activation of NF-kappaB and T-cell leukemia/lymphoma in Notch3 transgenic mice

D Bellavia et al. EMBO J. .

Abstract

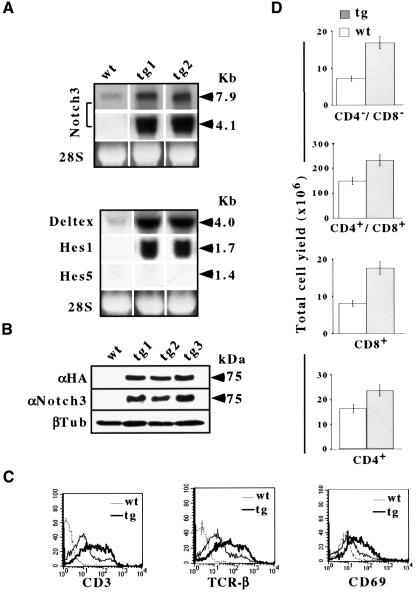
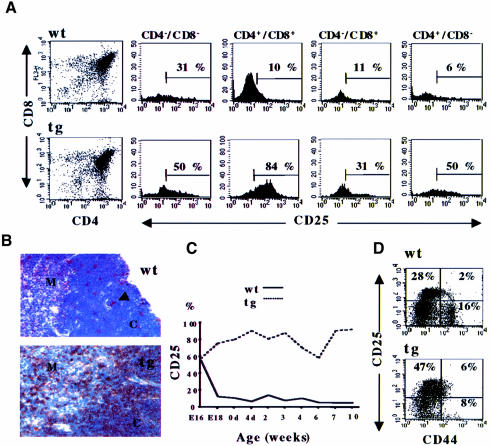
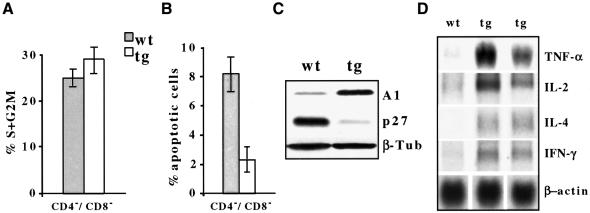
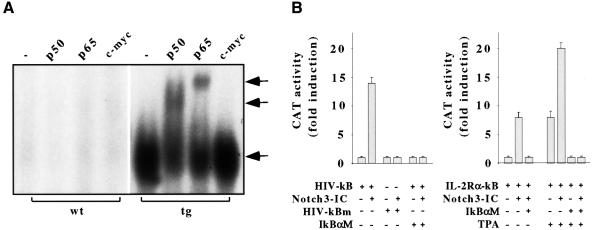
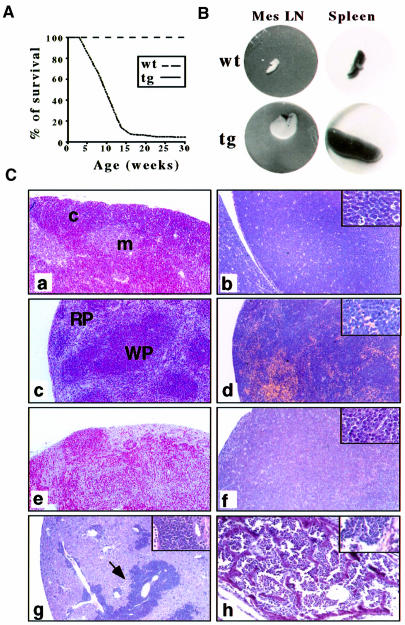
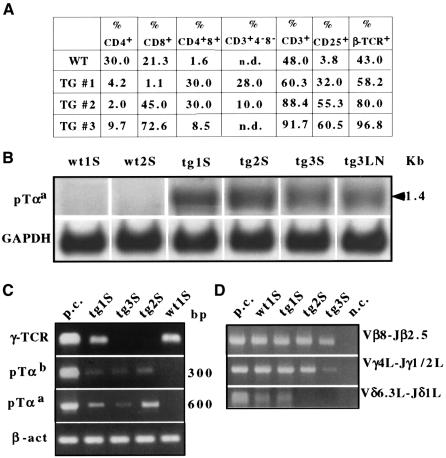
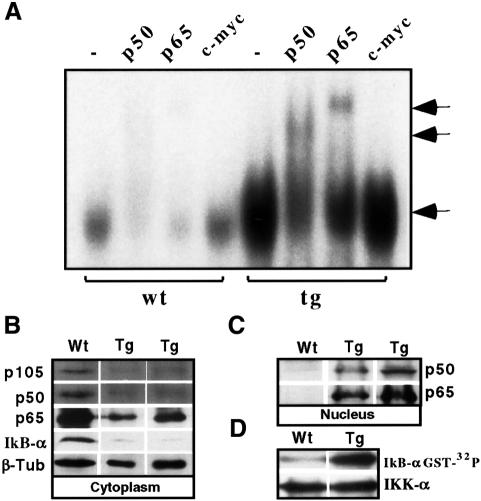
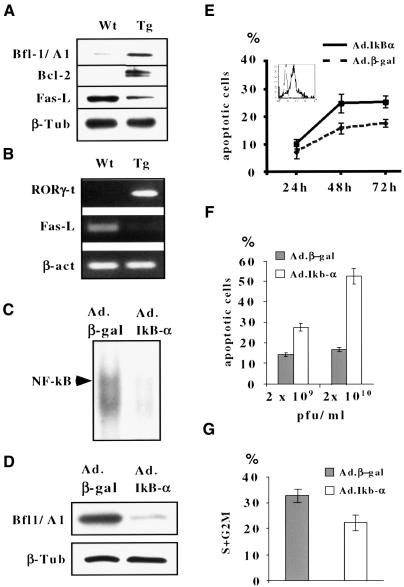
The multiplicity of Notch receptors raises the question of the contribution of specific isoforms to T-cell development. Notch3 is expressed in CD4(-)8(-) thymocytes and is down-regulated across the CD4(-)8(-) to CD4(+)8(+) transition, controlled by pre-T-cell receptor signaling. To determine the effects of Notch3 on thymocyte development, transgenic mice were generated, expressing lck promoter-driven intracellular Notch3. Thymuses of young transgenics showed an increased number of thymocytes, particularly late CD4(-)8(-) cells, a failure to down-regulate CD25 in post-CD4(-)8(-) subsets and sustained activity of NF-kappaB. Subsequently, aggressive multicentric T-cell lymphomas developed with high penetrance. Tumors sustained characteristics of immature thymocytes, including expression of CD25, pTalpha and activated NF-kappaB via IKKalpha-dependent degradation of IkappaBalpha and enhancement of NF-kappaB-dependent anti-apoptotic and proliferative pathways. Together, these data identify activated Notch3 as a link between signals leading to NF-kappaB activation and T-cell tumorigenesis. The phenotypes of pre-malignant thymocytes and of lymphomas indicate a novel and particular role for Notch3 in co-ordinating growth and differentiation of thymocytes, across the pre-T/T cell transition, consistent with the normal expression pattern of Notch3.


Figures

None
Fig. 1. (A) Northern blot analysis of the endogenous 7.9 kb Notch3 mRNA, transgene 4.1 kb Notch3-IC mRNA and HES-1, HES-5 and Deltex mRNAs in thymocytes of two individual tg(+) mouse lines (tg1 and tg2) and wild-type mice (wt), hybridized with Notch3-IC, HES-1 and HES-5 cDNAs (Felli et al., 1999) and RT–PCR-derived Deltex cDNA probe. (B) Immunoblot analysis of whole-cell lysates from wild-type and individual tg(+) mouse lines, using anti-HA tag (αHA), anti-Notch3 (αNotch3) and anti β-tubulin (β-tub) antibodies. (C) FCA of CD3, TCRβ chain and CD69 in thymocytes from 3-week-old tg(+) (tg) and wild-type (wt) mice. The plots are overlaid and superimposed on the fluorescence obtained with an irrelevant antibody (---). (D) Thymocyte subset total yield per thymus (detected by CD4 versus CD8 two-color FCA) in 3-week-old tg(+) (tg) and wild-type (wt) mice.
None
Fig. 2. Overexpression of CD25/IL-2Rα in thymocyte subsets of 3-week-old Notch3 tg(+) (tg) mice compared with wild-type (wt). (A) Three-color analysis of CD25 versus CD4 versus CD8 expression in CD48, CD4+8+, CD48+ and CD4+8 thymocyte subsets. Numbers indicate the percentages of CD25+ thymocytes. Left panels indicate the thymocyte subset distribution. (B) Immunohistochemical staining of CD25+ thymocytes in cryostat acetone-fixed sections from frozen thymic tissue, pre-incubated with rabbit serum, and then incubated sequentially with rat anti-mouse monoclonal antibody against CD25 and biotinylated rabbit anti-rat IgGs and streptavidin–HPR (PharMingen, San Diego, CA). CD25+ wt cells are scattered in the cortex (arrowhead), while most of the cortical (C) and medullary (M) tg(+) thymocytes are CD25+. Hematoxilin counterstain. Magnification: 250×. (C) Percentage of CD25+ thymocytes from wild-type (wt) and tg(+) (tg) mice at different ages (16 and 18 d.p.c., E16 and E18; 0 and 4 post-natal days, 0d and 4d; and indicated weeks). (D) Two-color analysis of CD44 versus CD25 expression in FACS-sorted DN thymocytes from wild-type and tg(+) mice. Numbers in the panels indicate the percentage of CD44+25, CD44+25+ and CD4425+ cells, respectively.
None
Fig. 3. Cell cycle (A), apoptosis (B), Bfl-1/A1 and p27 (C) and cytokine mRNA (D) expression analysis in thymocytes of 3-week-old wild-type (wt) and tg(+) (tg) mice. FACS-sorted CD48 cells were used for (A) and (B). Bfl-1/A1 and p27 were immunoblotted by using antibodies against p27, Bfl-1/A1 and β-tubulin, to monitor sample loading. (D) IL-2, IFN-γ, IL-4 and TNF-α mRNAs were revealed by northern blot analysis, using murine IL-2, IFN-γ, IL-4 and TNF-α cDNAs as probes.
None
Fig. 4. (A) Constitutive activation of the NF-κB complex in Notch3 tg(+) thymocytes. EMSA of NF-κB complexes in nuclear extracts from freshly isolated thymocytes of 3-week-old tg(+) (tg) or wild-type (wt) mice, incubated in the absence (–) (lower arrow) or presence of antibodies against either p50 or p65 or an unrelated antibody against c-myc. Antibody-mediated supershifted complexes (upper arrows) are indicated. (B) Notch3-IC enhances transcriptional activation from κB elements of HIV LTR and IL-2Rα promoter. M31T cells were transfected with 2 µg of HIV-κB-CAT, HIV-κBm-CAT or IL-2Rα-κB-CAT in the absence or presence of 4 µg of CMV-Notch3-IC or pCMX-IκBαM and assayed for CAT activity after 48 h. Phorbol ester (TPA) treatment (30 ng/ml, for 24 h) is indicated. Fold induction of CAT activity relative to basal CAT levels observed with reporter plasmid alone (assigned the value of 1) is indicated. CAT assays are normalized to co-transfected β-galactosidase expression vector.
None
Fig. 5. (A) Mortality curve of several lines of Notch3 tg(+) mice. Spontaneously dead tg(+) (tg) and wild-type mice (wt) were plotted against their age. Results are indicated as the percentage of surviving animals at each age [n = 100 for Notch3 tg(+) and n = 30 for wild-type mice]. (B) Macro scopic aspect of spleen and mesenteric lymph nodes (MesLN) isolated from wild-type (wt) and tg(+) (tg) mice. (C) Histological analysis of lymphoid and non-lymphoid organs from 12-week-old Notch3 tg(+) mice. Hematoxylin and eosin staining of 4 µm sections of 10% buffered formalin-fixed and paraffin-embedded tissues. Disruption of the architecture of tg(+) thymus (b), spleen (d) and lymph node (f) compared with wild-type organs (a, c and e; WP, white pulp; RP, red pulp; c, cortex; m, medulla) due to the complete substitution of the normal components by a population of lymphoblastic cells. The liver and bone marrow are infiltrated massively by neoplastic lymphoblast-like cells (g, arrow; h and inset). Infiltrating tumor cell (insets of b, d, f and g) show the features of lymphoblastic lymphoma cells: medium to large cells with roundish nuclei, a round central nucleolus and a small rim of cytoplasm. Hematoxylin and eosin staining. Panels: 160×. Insets: 1000×.
None
Fig. 6. (A) Percentages of CD4+, CD8+, CD3+, CD25+ and TCRβ+ chain wild-type splenic T cells and splenic lymphoma cells from representative individual tg(+) animals (Tg#1, #2 and #3) (assayed by FCA). n.d., not detected. (B) Northern blot analysis of the pTαa isoform in splenic T cells of wild type (wt1 and wt2) and in lymphoma cells of Notch3 tg(+) mice (Tg1, Tg2 and Tg3, as indicated in A) (S, spleen; LN, lymph node). (C) Expression of pTαa, pTαb and TCRγ chain genes in splenocytes (S) was assessed by RT–PCR. The positive control (p.c.) is thymocyte mRNA. (D) Rearrangements of TCRβ, δ and γ chains in genomic DNA were detected by PCR amplification of Vβ8–Jβ2.5, Vγ4L–Jγ1/2L and Vδ6.3L–Jδ1L regions. p.c. and n.c., positive and negative controls, respectively.
None
Fig. 7. Constitutive activation of the NF-κB complex in Notch3 tg(+) splenic T-lymphoma cells. (A) EMSA of NF-κB complexes in nuclear extracts from splenic T cells of 10-week-old tg(+) (tg) or wild-type (wt) mice, incubated in the absence (–) (lower arrow) or presence of antibodies against either p50, p65 or c-myc. Antibody-mediated supershifted complexes (upper arrows) are indicated. (B and C) Constitutive translocation of p65/p50 into the nucleus is associated with degradation of IκBα in T-lymphoma cells of Notch3 tg(+) mice. Immunoblots of nuclear and cytoplasmic cell extracts from splenic T cells isolated from two individual lines of 10-week-old tg(+) mice (tg) and wild-type animals (wt) were analyzed using antibodies against p50/105, p65 or IκBα. (D) Notch3 tg(+) T-lymphoma cells express constitutively activated IKKα activity. In vitro kinase assays, using IκBα–GST as an exogenous substrate (upper panel), were performed on IKKα immunoprecipitates (lower panel) from cell lysates of splenic T-lymphoma cells of 10-week-old tg(+) mice (tg) or wild-type splenic T cells (wt).
None
Fig. 8. Activation of anti-apoptotic pathways in Notch3-induced T-lymphoma cells in tg(+) mice. (A and B) Splenic T-lymphoma cells overexpress Bfl-1/A1, Bcl2 and RORγ t and down-regulate Fas-L expression. Whole-cell lysates or RNA were isolated from splenic T-lymphoma cells of 10-week-old Notch3 tg(+) mice (tg) or from wild-type splenic T cells (wt). Immunoblot analyses were performed using antibodies against murine Bfl-1/A1, Bcl2 or Fas-L (A). RORγ t and Fas-L mRNAs were evaluated by RT–PCR (B). (C–G) Inactivation of NF-κB by IκBα overexpression decreases spontaneous survival and proliferation of Notch3-induced lymphoma T cells. N3-232T cells were infected with either Ad-IκBα or Ad-β-gal as a control. EMSA of NF-κB DNA-binding activity (C), immunoblot of Bfl-1/A1 levels (D) and FCA of the percentage of apoptotic cells (E and F) or cells in S + G2–M cell cycle phases (G) were assessed 24–72 (E) or 48 h (C, D, F and G) after the infection with 2 × 10⁹ (D, E, F and G) or 2 × 10¹⁰ p.f.u./ml (C and F) recombinant adenoviruses. The inset of (E) shows β-gal fluorescence as a measure of adenoviral infection efficiency.

References

    1. Alesse E., Zazzeroni,F., Angelucci,A., Giannini,G., Di Marcotullio,L. and Gulino,A. (1998) The growth arrest and downregulation of c-myc transcription induced by ceramide are related events dependent on p21 induction, Rb underphosphorylation and E2F sequestering. Cell Death Differ., 5, 381–389. - PubMed
    1. Apelqvist A., Li,H., Sommer,L., Beatus,P., Anderson,D.J., Honjio,T., Hrabe de Angelis,M., Lendahl,U. and Edlund,H. (1999) Notch signalling controls pancreatic cell differentiation. Nature, 400, 877–881. - PubMed
    1. Artavanis-Tsakonas S., Rand,M.D. and Lake,R. (1999) Notch signaling: cell fate control and signal integration in development. Science, 284, 770–776. - PubMed
    1. Bakker T.R., Renno,T. and Jongeneel,C.V. (1999) Impaired fetal thymocyte development after efficient adenovirus-mediated inhibition of NF-κB activation. J. Immunol., 162, 3456–3462. - PubMed
    1. Barber D.F., Passoni,L., Wen,L., Geng,L. and Hayday,A.C. (1998) The expression in vivo of a second isoform of pTα: implications for the mechanism of pTα action. J. Immunol., 161, 11–16. - PubMed

Publication types

MeSH terms

Grants and funding