. 2000 Jul 15;20(14):5276-82.
doi: 10.1523/JNEUROSCI.20-14-05276.2000.

VMAT-Mediated changes in quantal size and vesicular volume

Affiliations

VMAT-Mediated changes in quantal size and vesicular volume

T L Colliver et al. J Neurosci. .

Abstract

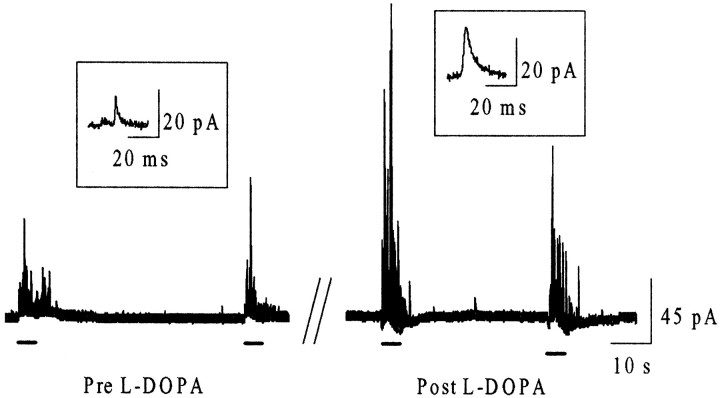
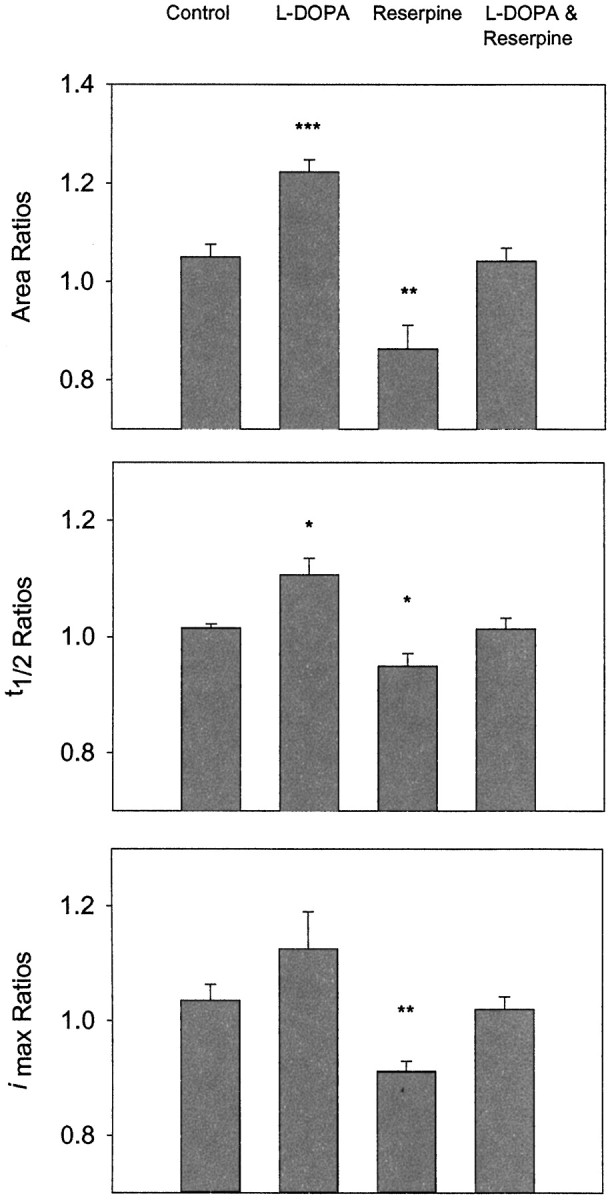
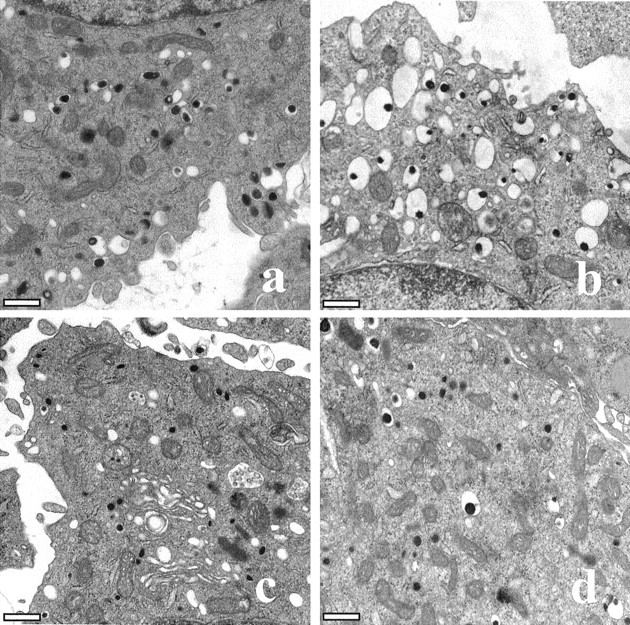
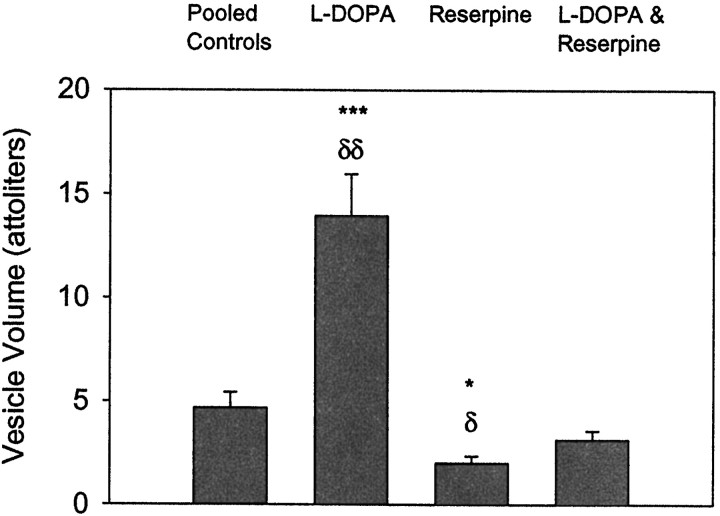
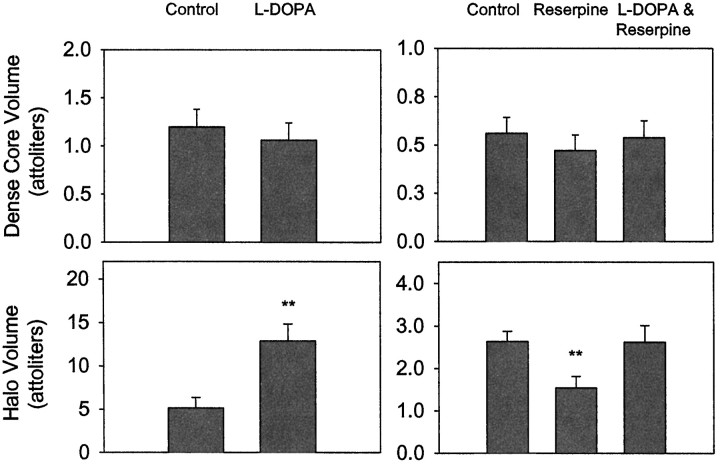
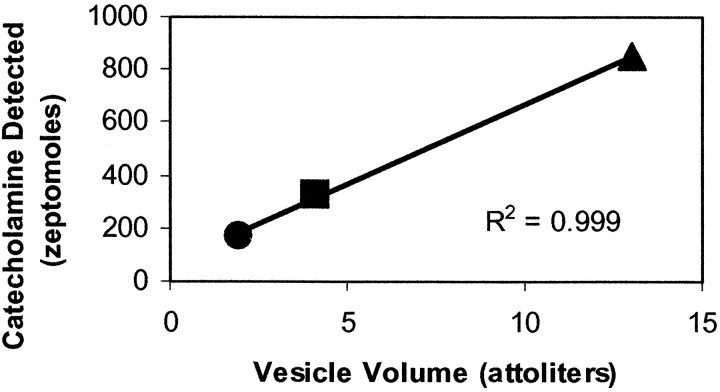
It has been well established that the volume of secretory vesicles can be modulated. However, we present the first data demonstrating that the amount of transmitter in a vesicle can regulate its volume. Amperometry and transmission electron microscopy have been used to determine that l-3,4-dihydroxyphenylalanine and reserpine increase and decrease, respectively, the volume of single pheochromocytoma cell vesicles as well as their catecholamine content. Because changes in vesicular catecholamine content are tracked by changes in vesicle volume, our results indicate that when quantal size is altered via the vesicular monoamine transporter the concentration of catecholamines within the vesicles remains relatively constant. This previously unidentified cellular response provides new insight into how catecholamines can be packaged in and released from secretory vesicles.


Figures

Fig. 1.
Fig. 1.
Representative amperometric data from a single PC12 cell before and after exposure to 100 μml-DOPA for 90 min. Insetsabove each of the main traces display individual events at smaller time and current scales. These individual spikes approximate the mean area, t1/2, andImax values measured before and after treatment with l-DOPA. Barsunder each of the main traces represent the time and duration of stimulus (100 mm K+) application.
Fig. 2.
Fig. 2.
Summary of spike characteristic ratio values created at individual PC12 cells. Ratios for each characteristic were created at a cell by dividing the mean of log values after the incubation period by the mean of log values before treatment (see Materials and Methods). Ratios created from control cells (i.e., cells not exposed to drug during the 90 min incubation period) yielded ratio values close to 1. Under control conditions there was an average of ∼194,000 ± 13 molecules released per vesicle. This value is slightly greater than those reported previously [114,300 (Chen et al., 1994); 74,736 (Pothos et al., 1996)] and could be attributable to differences in culturing protocols and/or experimental conditions. For the ratios presented, an average of 159 ± 29 and 104 ± 13 amperometric values was used to determine pre and post means, respectively. Error bars represent the mean ± SEM of spike characteristic ratio values for the different experimental conditions (Control, n = 6;l-DOPA, n = 7;Reserpine, n = 5;l-DOPA & Reserpine, n = 5). Values marked with *** are statistically different withp < 0.001, **significant difference withp < 0.01, and *significant difference withp < 0.05 versus control (Student's ttest).
Fig. 3.
Fig. 3.
Representative TEM images from single PC12 cells after treatment with (a) physiological saline, (b) 100 μml-DOPA, (c) 100 nm reserpine, and (d) 100 μml-DOPA and 100 nm reserpine for 90 min. A portion of the nucleus can be seen for the cells shown in a and b(at the top and bottom, respectively). Scale bars, 500 nm.
Fig. 4.
Fig. 4.
Summary of mean volume changes in PC12 dense core vesicles treated with l-DOPA and/or reserpine. Although vesicle volumes were determined for a total of five separate groups of cells (i.e., two control groups; see Materials and Methods), measurements from the separate control groups have been combined and labeled Pooled Controls in this figure so that the changes in vesicle volume can be compared directly with the amperometry results shown in Figure 2. Error bars represent mean ± SEM of mean volume values from all control cells (n = 23), cells exposed to l-DOPA (n = 10) or reserpine (n = 9), or both simultaneously (n = 9). An average of 42 ± 3 vesicles was measured per cell. Values marked with *** are statistically different with p < 0.001; *indicates a significant difference with p < 0.05 versus pooled controls (Student's t test). Those values marked with δδ and δ are significantly different from separate controls, withp < 0.01 and p < 0.05, respectively. Although mean values are shown in this figure, the same statistical trends were observed when the data were pooled from each group and compared statistically.
Fig. 5.
Fig. 5.
Summary of the effects of l-DOPA and/or reserpine on mean vesicle halo and dense core volume. The control values for l-DOPA-treated cells were measured from a total of 11 cells, and the second control group (i.e., for reserpine) consists of values from 12 different cells. The number of cells used for the other groups and the average number of vesicles measured per cell to calculate dense core and halo volumes are given in the legend to Figure 4. Error bars represent the mean ± SEM of mean vesicle halo and dense core volumes. Values marked with ** are statistically different, with p < 0.01 versus controls (Student's t test). Although mean values are shown in this figure, the same statistical trends were observed when the data were pooled from each group and statistically compared.
Fig. 6.
Fig. 6.
Correlation between the amount of neurotransmitter detected and the volume of PC12 dense core vesicles. Point estimates for moles of catecholamine released per vesicle and vesicle volume were determined from PC12 cells after treatment with 100 μml-DOPA (▴), 100 nm reserpine (●), or only physiological saline (▪) for 90 min. After treatment with reserpine, one cell continued to release an unusually large amount of neurotransmitter with an apparent concentration of 450 mmper vesicle. This cell was excluded for these comparisons. Amount and volume values measured from PC12 cells simultaneously exposed tol-DOPA and reserpine are similar in magnitude to those measured from control cells. For clarity, these values have been excluded from this figure. When amount and volume values measured from PC12 cells simultaneously exposed to l-DOPA and reserpine for 90 min and to only l-DOPA for 30 min are combined with those shown above (i.e., for a total of five treatment conditions), the calculated correlation coefficient is 0.892.

Similar articles

Cited by

References

    1. Albillos A, Dernick G, Horstmann H, Almers W, Alvarez de Toledo G, Lindau M. The exocytotic event in chromaffin cells revealed by patch amperometry. Nature. 1997;389:509–512. - PubMed
    1. Borges R, Travis ER, Hochstetler SE, Wightman RM. Effects of external osmotic pressure on vesicular secretion from bovine adrenal medullary cells. J Biol Chem. 1997;272:8325–8331. - PubMed
    1. Breckenridge LJ, Almers W. Final steps in exocytosis observed in a cell with giant secretory granules. Proc Natl Acad Sci USA. 1987;84:1945–1949. - PMC - PubMed
    1. Brodwick MS, Curran M, Edwards C. Effects of osmotic stress on mast cell vesicles of the beige mouse. J Membr Biol. 1992;126:159–169. - PubMed
    1. Chen TK, Luo G, Ewing AG. Amperometric monitoring of stimulated catecholamine release from rat pheochromocytoma (PC12) cells at the zeptomole level. Anal Chem. 1994;66:3031–3035. - PubMed

Publication types

MeSH terms

LinkOut - more resources