. 2000 Jul 15;20(14):5503-15.
doi: 10.1523/JNEUROSCI.20-14-05503.2000.

Periodicity and firing rate as candidate neural codes for the frequency of vibrotactile stimuli

Affiliations

Periodicity and firing rate as candidate neural codes for the frequency of vibrotactile stimuli

E Salinas et al. J Neurosci. .

Abstract

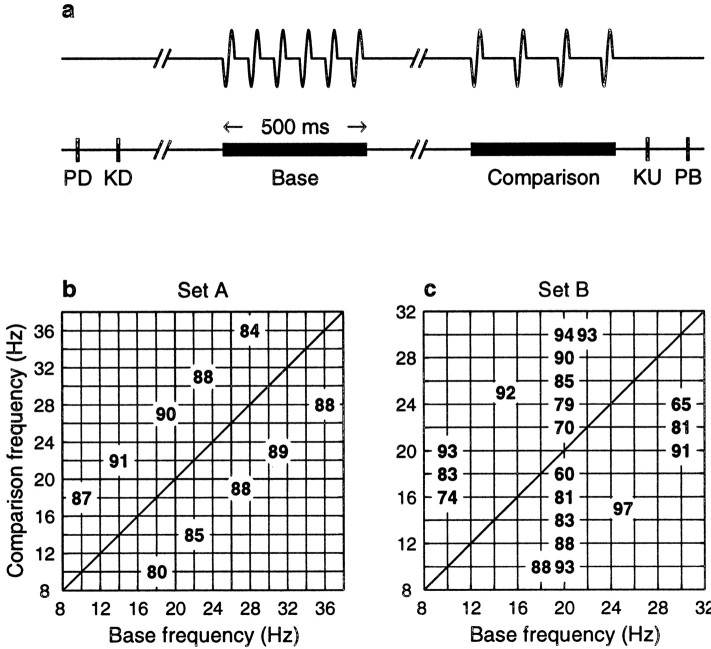
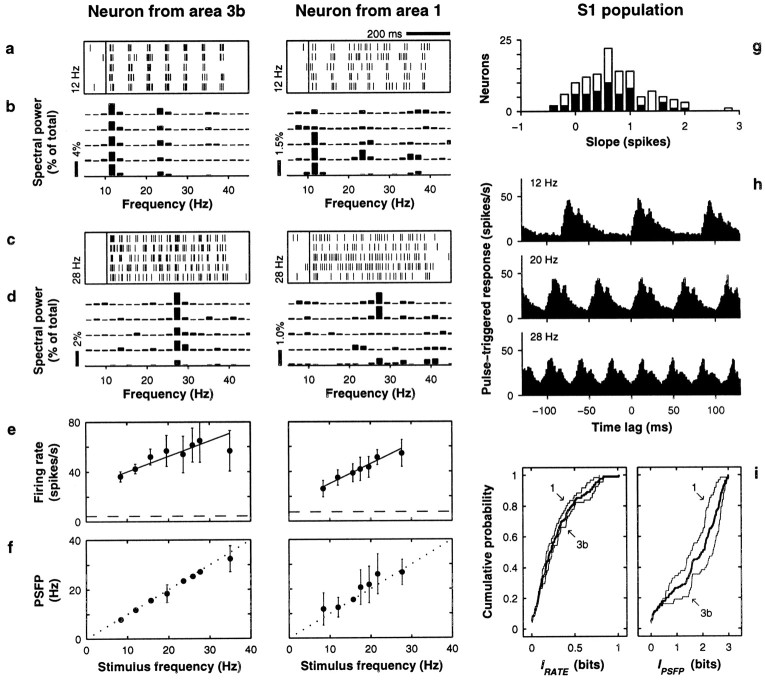
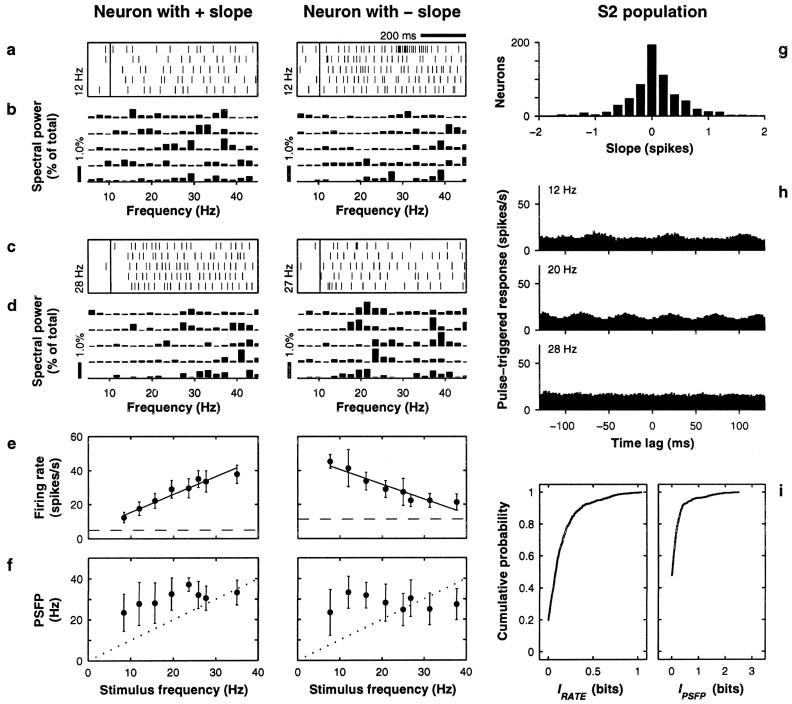
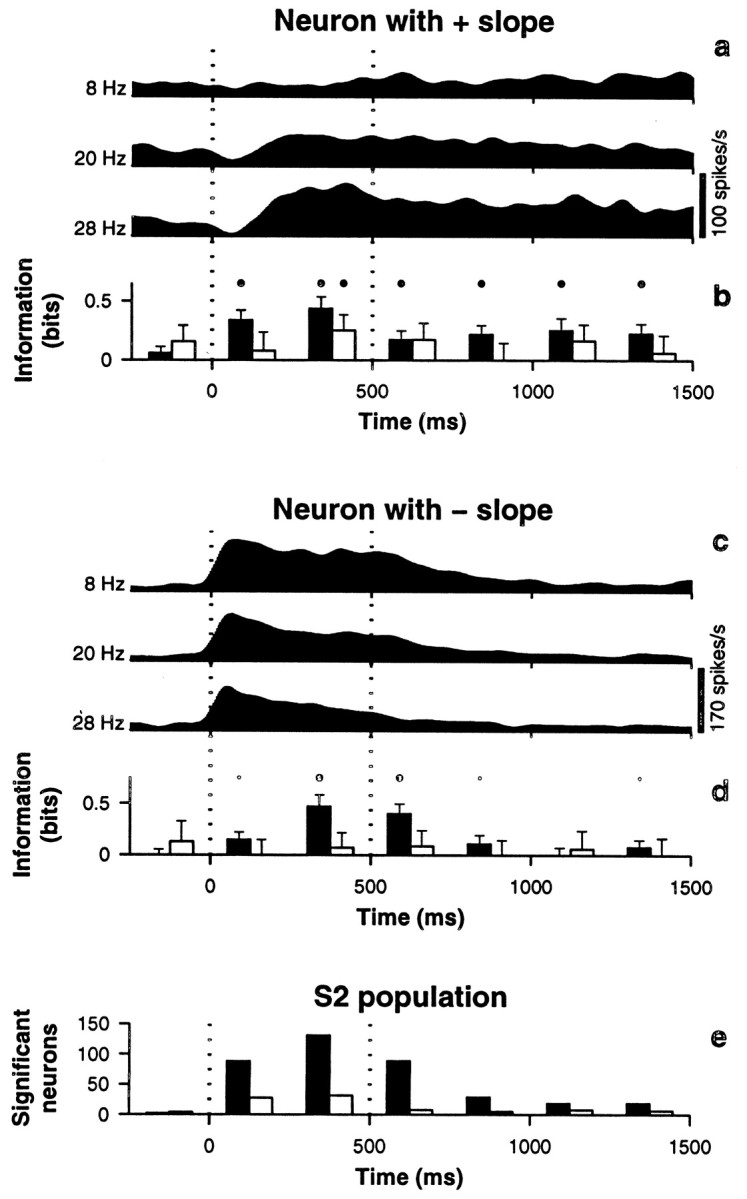
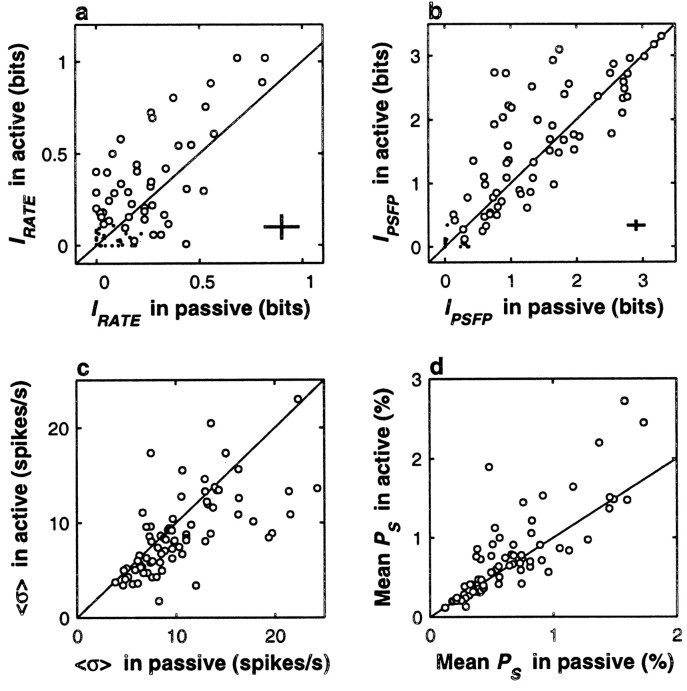
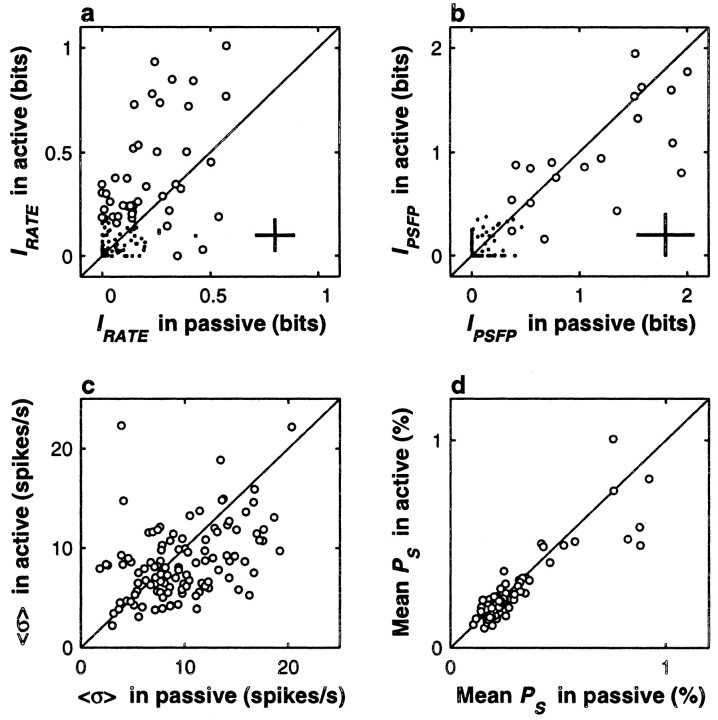
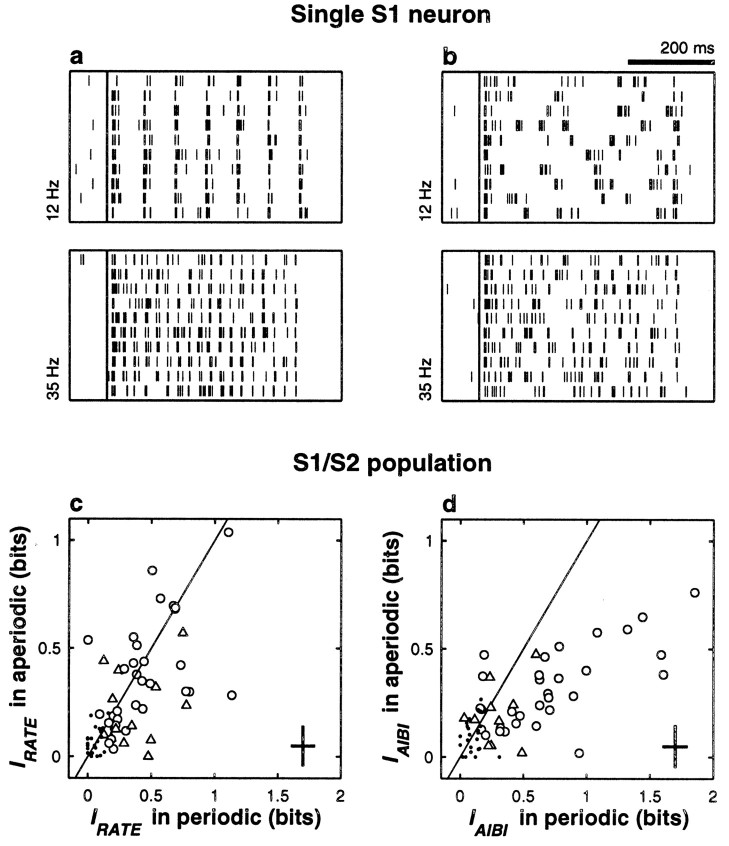
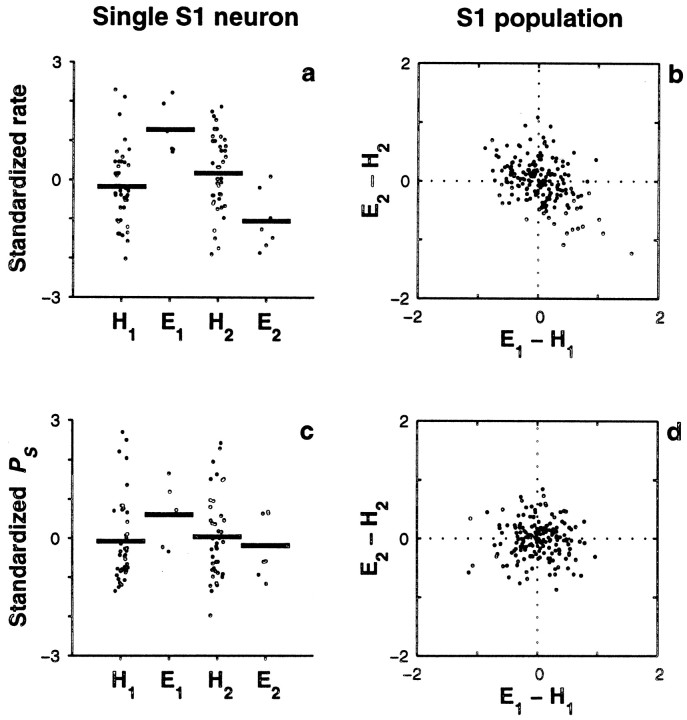
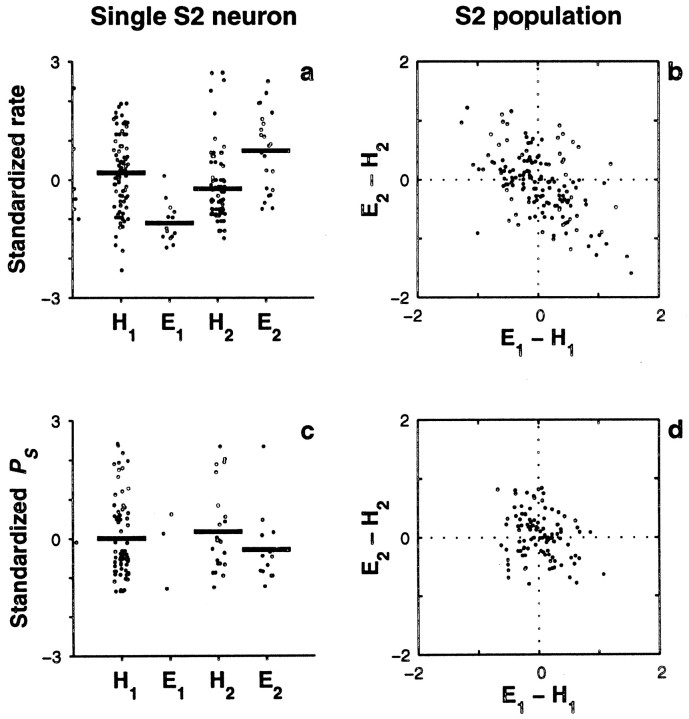
The flutter sensation is felt when mechanical vibrations between 5 and 50 Hz are applied to the skin. Neurons with rapidly adapting properties in the somatosensory system of primates are driven very effectively by periodic flutter stimuli; their evoked spike trains typically have a periodic structure with highly regular time differences between spikes. A long-standing conjecture is that, such periodic structure may underlie a subject's capacity to discriminate the frequencies of periodic vibrotactile stimuli and that, in primary somatosensory areas, stimulus frequency is encoded by the regular time intervals between evoked spikes, not by the mean rate at which these are fired. We examined this hypothesis by analyzing extracellular recordings from primary (S1) and secondary (S2) somatosensory cortices of awake monkeys performing a frequency discrimination task. We quantified stimulus-driven modulations in firing rate and in spike train periodicity, seeking to determine their relevance for frequency discrimination. We found that periodicity was extremely high in S1 but almost absent in S2. We also found that periodicity was enhanced when the stimuli were relevant for behavior. However, periodicity did not covary with psychophysical performance in single trials. On the other hand, rate modulations were similar in both areas, and with periodic and aperiodic stimuli, they were enhanced when stimuli were important for behavior, and were significantly correlated with psychophysical performance in single trials. Thus, the exquisitely timed, stimulus-driven spikes of primary somatosensory neurons may or may not contribute to the neural code for flutter frequency, but firing rate seems to be an important component of it.


Figures

Fig. 1.
Fig. 1.
Behavioral paradigm and stimulus sets used.a, Schematic diagram of the task. In each trial, the mechanical probe was lowered so that it touched one of the fingertips of the restrained hand (PD, probe down); the monkey reacted, placing its free hand on a lever within 1 sec after indentation (KD, key down); after a delay period (1.5–3 sec) the probe oscillated vertically, delivering a series of pulses at a base frequency; after an interstimulus interval (1–3 sec), a second set of pulses was delivered at a comparison frequency; after the end of the comparison stimulus, the monkey had to release the lever within 600 msec (KU, key up) and press one of two push-buttons (PB). One button indicated that the comparison frequency was higher than the base, and the other indicated that the comparison was lower than the base. b, c, Two stimulus sets frequently used in the experiments. The numbers inside the grid indicate the percentage of correct responses for each base-comparison combination.Set A had constant differences of 8 Hz between base and comparison. Percentages are based on the performance of three monkeys throughout 350 runs with this set. Set B was designed to vary the difficulty of the task in a more systematic manner. The percentages shown correspond to 42 runs from two monkeys.
Fig. 2.
Fig. 2.
Neuronal responses in S1. Left andmiddle columns show data, in the same format, from two neurons from areas 3b and 1, respectively. The right columnshows population data from 68 neurons in area 3b and 61 neurons in area 1. All plots are based on neuronal activity evoked by the base stimulus. a, c, Raster plots from five trials in which stimulus frequency was 12 Hz (a) and 28 Hz (c).Small vertical ticks indicate spikes; each rowcorresponds to one trial. The long vertical line indicates stimulation onset. b, d, Power spectra of the five spike trains shown immediately above. Power is expressed as percentage of total power across all bins, but only frequencies within the flutter range are shown. e, Mean firing rate (±1 SD) as a function of stimulus frequency. Continuous line indicates best linear fit; dashed line indicates baseline firing rate, computed in the 800 msec preceding stimulation onset. For the neurons on theleft and middle columns, IRATE = 0.50 ± 0.10 and 0.58 ± 0.09 bits, respectively (both significant). f, Mean PSFP (±1 SD) as a function of stimulus frequency. The diagonal dotted line indicates equality between x and y axes. For the neurons on the left and middle columns, IPSFP = 2.71 ± 0.03 and 2.08 ± 0.04 bits, respectively (both significant). Because PSFP values were discrete and often distributed bimodally, SDs here suggest more overlap between response distributions than was actually measured.g, Distribution of slopes from linear fits to the rate-versus-frequency curves (as in e). White andblack bars correspond to area 3b and area 1 neurons, respectively. h, Average S1 responses triggered on individual stimulation pulses. The three histogramscorrespond to stimulation at 12, 20, and 28 Hz and were constructed from the responses of 89–102 S1 neurons tested at these frequencies. The y axis indicates the firing rate (in 1 msec time bins), averaged over neurons and trials, x milliseconds before or after the onset of an individual stimulation pulse, where x is called the time lag. Phase-locking is readily apparent at all frequencies. i, Cumulative distributions for IRATE and IPSFP. The value on the y axis represents the fraction of neurons with information smaller or equal to the amount indicated on the x axis. Thin lines indicate separate distributions for areas 3b and 1; thick lines correspond to pooled data sets. Note the different scales on the x axes.
Fig. 3.
Fig. 3.
Neuronal responses in S2. Left andmiddle columns show data from two neurons: the firing rate of one increases with increasing stimulus frequency (positive slope), and the firing rate of the other decreases with increasing stimulus frequency (negative slope). Slopes were extracted from the linear fits shown in e. Same format is used as in Figure 2, except ind, middle column, frequency was 27 Hz; in e, IRATE = 0.89 ± 0.09 and 0.75 ± 0.13 bits for left and middle columns, respectively (both significant); in h, IPSFP = 0.26 ± 0.18 and IPSFP = 0 ± 0.30 bits, forleft and middle columns, respectively (both not significant). In h, histograms are averages of 250–287 neurons (note same scale as in Fig. 2). Population data in gand i are based on 689 S2 neurons. All data are based on neuronal activity evoked by the base stimulus.
Fig. 4.
Fig. 4.
Sustained neuronal responses in S2. The base stimulus turned on at time zero, lasting 500 msec; stimulus onset and offset are indicated by dotted vertical lines. Interstimulus interval duration was 1–3 sec. a, Spike density histograms of a neuron that fired most strongly at high frequencies (positive slope). For the shown traces, stimulus frequencies were 8, 20, and 28 Hz, as indicated. b, Information (+1 SD) carried by the neuron illustrated in a as a function of time. IRATE (black bars) and IPSFP (white bars) were computed every 250 msec using the spikes contained in a 250 msec time window centered at the midpoint (x coordinate) between bars.Large and small dots indicate significance levels of p < 0.01 and p < 0.05, respectively. c, Spike density histograms of a neuron that fired most strongly at low frequencies (negative slope); same stimulus frequencies as in a. d, Information carried by the neuron illustrated in c as a function of time. e, Number of neurons with significant (p < 0.01) information about stimulus frequency as a function of time. Black barscorrespond to IRATE and white bars to IPSFP, as in b and d. All spike densities were obtained by convolving the spike trains with a Gaussian kernel of SD equal to 30 msec and averaging over trials of equal frequency.
Fig. 5.
Fig. 5.
Behavioral context modulates neuronal activity in S1. In all plots, responses during active discrimination (y axes) are compared with responses during passive stimulation (x axes). Diagonal lines indicate equality between x and y axes. All comparisons are based on the responses of 77 S1 neurons tested in both situations. All quantities were computed from the responses to the comparison stimulus. a, The mean IRATE was significantly higher during active discrimination (p < 0.0004); note that higher values tend to fall above the x = y line. Circles correspond to 50 neurons with IRATE significantly different from zero in at least one of the two conditions, and dots indicate nonsignificant neurons. Crosses indicate the mean uncertainty in the information values; they correspond to ±1 average SD in each direction. b, Circles correspond to 63 neurons with IPSFP significantly different from zero in at least one of the two conditions, and dots indicate nonsignificant neurons. The mean IPSFP was higher during active discrimination, and the effect was close to but below the significance threshold (p > 0.025).Crosses correspond to ±1 average SD in each direction.c, Trial-to-trial variability in the firing rate, quantified by 〈ς〉, was significantly smaller during active discrimination (p < 0.0002); note that small values, which correspond to higher reliability, tend to fall below the x = yline. d, The mean amplitude of the Fourier spectrum at the stimulus frequency (mean PS) was significantly higher during active discrimination (p < 0.005). This indicates that in this condition, the evoked spikes were more phase-locked to the stimulus.
Fig. 6.
Fig. 6.
Behavioral context modulates neuronal activity in S2. In all plots, responses during active discrimination (y axes) are compared with responses during passive stimulation (x axes). Diagonal lines indicate equality between x and y axes. All comparisons are based on the responses of 108 S2 neurons tested in both situations. Format is the same as in Figure 5, except that all quantities were computed from the responses to the base stimulus. a, The mean IRATE was significantly higher during active discrimination (p < 0.0002); note that higher values tend to fall above the x = y line. Circlescorrespond to 43 neurons with IRATEsignificantly different from zero in at least one of the two conditions, and dots indicate nonsignificant neurons.Crosses indicate the mean uncertainty in the information values; they correspond to ±1 average SD in each direction. b, Circles correspond to 19 neurons with IPSFPsignificantly different from zero in at least one of the two conditions, and dots indicate nonsignificant neurons. The mean IPSFP was not significantly different in the two conditions (p > 0.11). Crossescorrespond to ±1 average SD in each direction. c, Trial-to-trial variability in the firing rate, quantified by 〈ς〉, was significantly smaller during active discrimination (p < 0.0062); note that small values, which correspond to higher reliability, tend to fall below the x = y line. d, The mean amplitude of the Fourier spectrum at the stimulus frequency (mean PS) did not change across conditions (p > 0.06).
Fig. 7.
Fig. 7.
Neuronal responses to periodic and aperiodic stimuli. The four raster plots at the top show spike trains from an S1 neuron that was tested with periodic (a) and aperiodic (b) stimuli at frequencies of 12 and 35 Hz, as indicated. Each set of responses includes 10 trials collected during active discrimination. For a given stimulus frequency, the train of stimulation pulses was identical for all periodic trials but was different for all aperiodic trials. However, at a given mean frequency, the total number of pulses delivered was the same in both conditions.Long vertical lines indicate stimulus onset. In the periodic condition the neuron had IRATE = 0.67 ± 0.10 and IAIBI = 1.44 ± 0.10 bits; with aperiodic stimulation IRATE = 0.70 ± 0.10 and IAIBI = 0.65 ± 0.11 bits. IRATE (c) and IAIBI (d) were computed for 41 S1 and 30 S2 neurons tested with periodic and aperiodic stimuli. In both panels, circles and triangles correspond to S1 and S2 neurons, respectively, with significant information in at least one of the two conditions (periodic or aperiodic), and small dots indicate S1 and S2 neurons that had nonsignificant values in the two conditions. Diagonal lines indicate equal values in the two axes. Crosses on the bottom right cornersindicate ±1 average SD in each direction. IRATEdid not change across conditions, in either area; data points in c are distributed symmetrically around the diagonal line. IAIBI was significantly larger with periodic stimulation; data points in dtend to fall below the diagonal. With aperiodic pulses, IAIBI was similar to IRATE; the y -axis values inc and d are similar (see Results).
Fig. 8.
Fig. 8.
Single-trial covariations between behavioral responses and neuronal responses in S1. This analysis was based on the neuronal activity evoked by the comparison stimulus. a, Standardized firing rates (dots) for a single S1 neuron are shown subdivided into four categories: hits (H1) and errors (E1) when the frequency of the base stimulus was higher than the frequency of the comparison stimulus (type 1 trials), and hits (H2) and errors (E2) when the frequency of the comparison stimulus was higher than the frequency of the base (type 2 trials).Thick horizontal lines represent mean values for each category. For this neuron, the mean values in error trials were significantly different (p < 0.002) from the mean values in hit trials of the same type. This neuron had a positive slope of 1.17 ± 0.12 spikes. b, The standardized firing rate reveals a negative correlation between error types in S1. Each point represents one of 191 S1 neurons with at least five errors of each type. For each neuron, the mean difference in standardized rate between errors and hits for type 2 trials (E2 − H2) was computed and plotted versus the mean difference for type 1 trials (E1 − H1). The population shows a negative correlation between error types: Pearson's linear correlation coefficient was −0.42 (p < 0.0002). Dotted lines indicate the origin. c, Standardized power at the stimulus frequency (PS) for the neuron illustrated in a, with trials subdivided into the same four hit/error categories. The differences in mean between hits and errors of the same type were not significant, although this neuron had significant IPSFP (0.80 ± 0.14 bits).d, The standardized PS shows no correlation between error types in S1. The plot shows mean differences in standardized PS between errors and hits for type 2 versus type 1 trials for 184 S1 neurons. The correlation coefficient was practically zero (0.008, p > 0.9).Dotted lines indicate the origin.
Fig. 9.
Fig. 9.
Single-trial covariations between behavioral responses and neuronal responses in S2, based on the neuronal activity evoked by the comparison stimulus. Same format as in Figure 8.a, Standardized firing rates (dots) for a single S2 neuron are shown subdivided into four categories: hits (H1) and errors (E1) when the frequency of the base stimulus was higher than the frequency of the comparison stimulus (type 1 trials), and hits (H2) and errors (E2) when the frequency of the comparison stimulus was higher than the frequency of the base (type 2 trials).Thick horizontal lines represent mean values for each category. For this neuron, the mean values in error trials were significantly different (p < 0.0002) from the mean values in hit trials of the same type. b, The standardized firing rate reveals a negative correlation between error types in S2. Each point represents one of 128 S2 neurons with at least five errors of each type. For each neuron, the mean difference in standardized rate between errors and hits for type 2 trials (E2 − H2) was computed and plotted versus the mean difference for type 1 trials (E1 − H1). The population shows a negative correlation between error types: Pearson's linear correlation coefficient was −0.52 (p < 0.0002).Dotted lines indicate the origin. c, Standardized power at the stimulus frequency (PS) for the neuron illustrated in a, with trials subdivided into the same four hit/error categories. The differences in mean between hits and errors of the same type were not significant. d, Mean differences in standardized PS between errors and hits for type 2 versus type 1 trials for 103 S2 neurons. There was a small, nonsignificant correlation of −0.23 (p > 0.025).Dotted lines indicate the origin.

References

    1. Abbott LF, Dayan P. The effect of correlated activity on the accuracy of a population code. Neural Comput. 1999;11:91–101. - PubMed
    1. Abbott LF, Rolls ET, Tovee MJ. Representational capacity of face coding in monkeys. Cereb Cortex. 1996;6:498–505. - PubMed
    1. Ahissar E. Temporal-code to rate-code conversion by neuronal phase-locked loops. Neural Comput. 1998;10:597–650. - PubMed
    1. Ahissar E, Vaadia E. Oscillatory activity of single units in a somatosensory cortex of an awake monkey and their possible role in texture analysis. Proc Natl Acad Sci USA. 1990;87:8935–8939. - PMC - PubMed
    1. Cariani PA, Delgutte B. Neural correlates of the pitch of complex tones. I. Pitch and pitch salience. J Neurophysiol. 1996;76:1698–1716. - PubMed

Publication types

LinkOut - more resources