. 2000 Jul 1;14(13):1584-8.

Cooperative effects of genes controlling the G(2)/M checkpoint

Affiliations

Cooperative effects of genes controlling the G(2)/M checkpoint

T A Chan et al. Genes Dev. .

Abstract

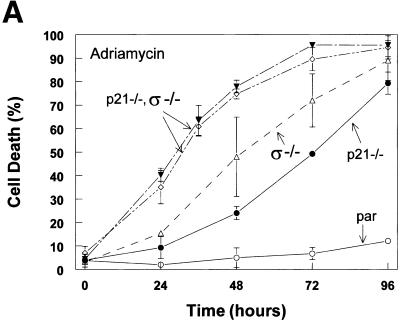
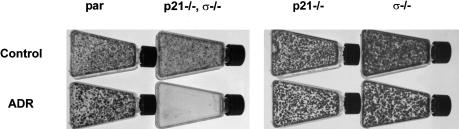
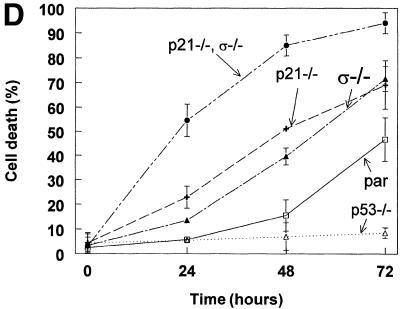
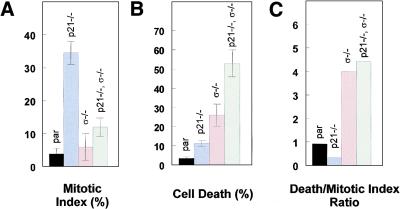
It is believed that multiple effectors independently control the checkpoints permitting transitions between cell cycle phases. However, this has not been rigorously demonstrated in mammalian cells. The p53-induced genes p21 and 14-3-3sigma are each required for the G(2) arrest and allow a specific test of this fundamental tenet. We generated human cells deficient in both p21 and 14-3-3sigma and determined whether the double knockout was more sensitive to DNA damage than either single knockout. p21(-/-) 14-3-3sigma(-/-) cells were significantly more sensitive to DNA damage or to the exogenous expression of p53 than cells lacking only p21 or only 14-3-3sigma. Thus, p21 and 14-3-3sigma play distinct but complementary roles in the G(2)/M checkpoint, and help explain why genes at the nodal points of growth arrest pathways, like p53, are the targets of mutation in cancer cells.


Figures

Figure 1
Figure 1
Generation of human cells lacking 14-3-3ς and p21. HCT116 CRC cells were transfected with 14-3-3ς targeting constructs, and knockout cells were identified as described in Chan et al. (1999). Southern analysis was used to confirm the successful deletion of both 14-3-3ς alleles (top). 14-3-3ς−/− cells were transfected with p21 targeting vectors, and clones with successfully targeted alleles were identified by PCR and confirmed by Southern blot as in Waldman et al. (1995) (bottom). Wild-type and targeted alleles are labeled and marked with arrows.
Figure 2
Figure 2
Cells lacking 14-3-3ς and p21 are more sensitive to DNA damage than cells lacking either 14-3-3ς or p21. (A) Cells were treated with 0.2 μg/ml adriamycin for the times indicated. Cells were harvested and scored for death after staining with Hoechst 33258. (▾,⋄) p21−/−, ς−/−; (▵) ς−/−; (●) p21−/−; (par) parental cells containing normal 14-3-3ς and p21 genes. Error bars correspond to one standard deviation; the points represent the mean cell death determined from at least three independent experiments. (B) Compromised cell cycle arrest in cells deficient in p21 and 14-3-3ς. Cells of the indicated genotypes were treated with adriamycin, harvested at the indicated times, stained with Hoechst 33258, and subjected to flow cytometry. Peaks corresponding to 2N and 4N are labeled accordingly.
Figure 2
Figure 2
Cells lacking 14-3-3ς and p21 are more sensitive to DNA damage than cells lacking either 14-3-3ς or p21. (A) Cells were treated with 0.2 μg/ml adriamycin for the times indicated. Cells were harvested and scored for death after staining with Hoechst 33258. (▾,⋄) p21−/−, ς−/−; (▵) ς−/−; (●) p21−/−; (par) parental cells containing normal 14-3-3ς and p21 genes. Error bars correspond to one standard deviation; the points represent the mean cell death determined from at least three independent experiments. (B) Compromised cell cycle arrest in cells deficient in p21 and 14-3-3ς. Cells of the indicated genotypes were treated with adriamycin, harvested at the indicated times, stained with Hoechst 33258, and subjected to flow cytometry. Peaks corresponding to 2N and 4N are labeled accordingly.
Figure 3
Figure 3
Decreased clonogenic survival of p21−/− 14-3-3ς−/− cells following DNA damage. Cells with indicated genotypes were treated with 0.02 μg/ml adriamycin and replated in new flasks (ADR). Colonies were stained with crystal violet 7–10 days later. (Control) Cells were not treated with adriamycin.
Figure 4
Figure 4
Cooperative effect of p21 and 14-3-3ς in determining cell cycle arrest vs. death following expression of p53. (A) Cells of the indicated genotypes were infected with an adenovirus that directed the expression of p53 and GFP. (Top) GFP expression of the cells 20 hr following start of infection; (Bottom) the same field of cells under bright field. Cells of all the genotypes became infected with the p53 adenovirus to a similar extent. Similar infection frequencies were obtained with the mutant p53 adenovirus (data not shown). (B) Cells lacking both p21 and 14-3-3ς died more readily following expression of p53 than cells lacking only one or none of the two genes. (●) p21−/−, ς−/−; (▴) ς−/−; (+) p21−/−; □, (par) parental cells containing normal 14-3-3ς and p21 genes. (C) No cell death was observed in any of the cells upon infection with an adenovirus expressing inactive mutant p53 (R175H). Labels as in B. (D) Cells lacking both p21 and 14-3-3ς are sensitive to 5-FU. 5-FU was used to induce endogenous p53 expression. Cells were scored for death at the indicated time points. Error bars correspond to one standard deviation; the points represent the mean cell death determined from at least three independent experiments.(▵) p53−/−; other labels as in B.
Figure 4
Figure 4
Cooperative effect of p21 and 14-3-3ς in determining cell cycle arrest vs. death following expression of p53. (A) Cells of the indicated genotypes were infected with an adenovirus that directed the expression of p53 and GFP. (Top) GFP expression of the cells 20 hr following start of infection; (Bottom) the same field of cells under bright field. Cells of all the genotypes became infected with the p53 adenovirus to a similar extent. Similar infection frequencies were obtained with the mutant p53 adenovirus (data not shown). (B) Cells lacking both p21 and 14-3-3ς died more readily following expression of p53 than cells lacking only one or none of the two genes. (●) p21−/−, ς−/−; (▴) ς−/−; (+) p21−/−; □, (par) parental cells containing normal 14-3-3ς and p21 genes. (C) No cell death was observed in any of the cells upon infection with an adenovirus expressing inactive mutant p53 (R175H). Labels as in B. (D) Cells lacking both p21 and 14-3-3ς are sensitive to 5-FU. 5-FU was used to induce endogenous p53 expression. Cells were scored for death at the indicated time points. Error bars correspond to one standard deviation; the points represent the mean cell death determined from at least three independent experiments.(▵) p53−/−; other labels as in B.
Figure 5
Figure 5
Distinct functions of p21 and 14-3-3ς following DNA damage. (A) Cells of the indicated genotypes were treated with 0.2 μg/ml adriamycin for 12 hr and subsequently with colcemid for 20 hr. The y-axis corresponds to the percentage of cells in mitosis (mitotic index). Error bars correspond to one standard deviation; the bars represent the means determined from at least three independent experiments. (B) Cells were treated as in A and cell death was scored. The y-axis corresponds to percentage of dead cells. (C) Cells were treated as in A. The y-axis corresponds to the ratio between the fraction of dead cells to the fraction of cells arrested in mitosis.

Similar articles

Cited by

References

    1. Agarwal ML, Agarwal A, Taylor WR, Stark GR. p53 controls both the G2/M and the G1 cell cycle checkpoints and mediates reversible growth arrest in human fibroblasts. Proc Natl Acad Sci. 1995;92:8493–8497. - PMC - PubMed
    1. Brugarolas J, Chandrasekaran C, Gordon JI, Beach D, Jacks T, Hannon GJ. Radiation-induced cell arrest compromised by p21 deficiency. Nature. 1995;377:552–557. - PubMed
    1. Bunz F, Dutriaux A, Lengauer C, Waldman T, Zhou S, Brown JP, Sedivy JM, Kinzler KW, Vogelstein B. Requirement for p53 and p21 to sustain G2 arrest after DNA damage. Science. 1998;282:1497–1501. - PubMed
    1. Bunz F, Hwang PM, Torrance C, Waldman T, Zhang Y, Dillehay L, Williams J, Lengauer C, Kinzler KW, Vogelstein B. Disruption of p53 in human cancer cells alters the responses to therapeutic agents. J Clin Invest. 1999;104:263–269. - PMC - PubMed
    1. Cahill DP, Lengauer C, Yu J, Riggins GJ, Willson JK, Markowitz SD, Kinzler KW, Vogelstein B. Mutations of mitotic checkpoint genes in human cancers. Nature. 1998;392:300–303. - PubMed

Publication types