. 2000 Jul 1;14(13):1664-77.

Coregulation of anterior and posterior mesendodermal development by a hairy-related transcriptional repressor

Affiliations

Coregulation of anterior and posterior mesendodermal development by a hairy-related transcriptional repressor

L Bally-Cuif et al. Genes Dev. .

Abstract

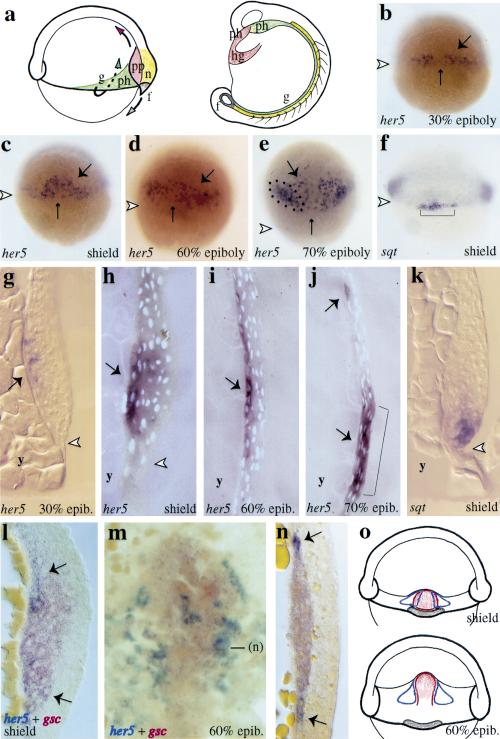
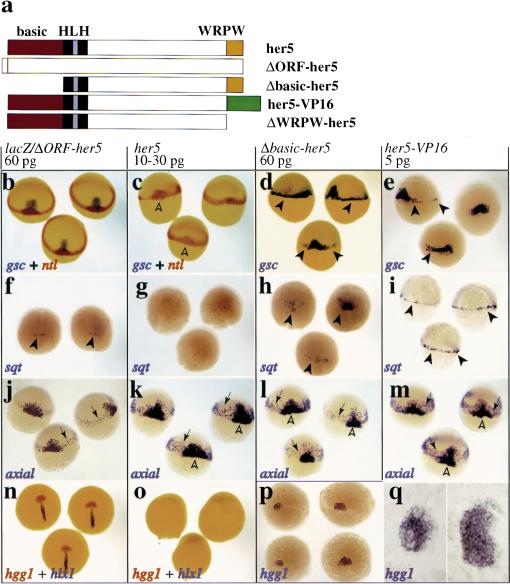
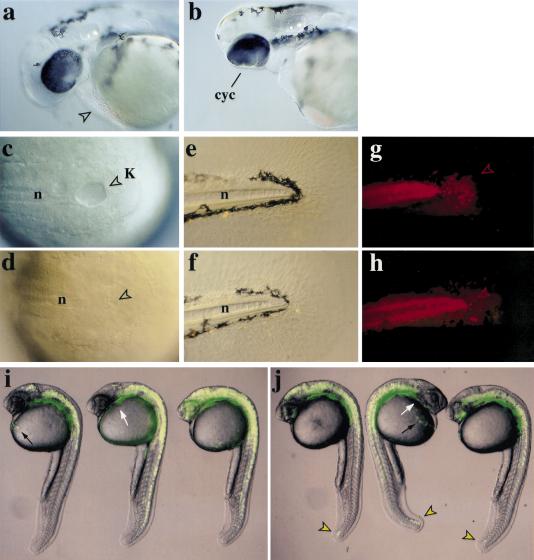
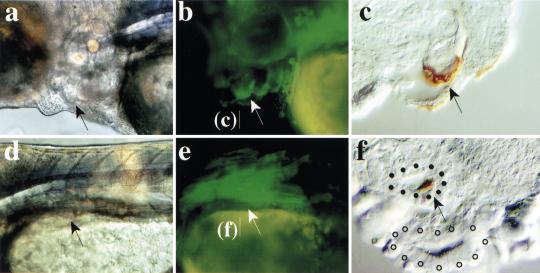
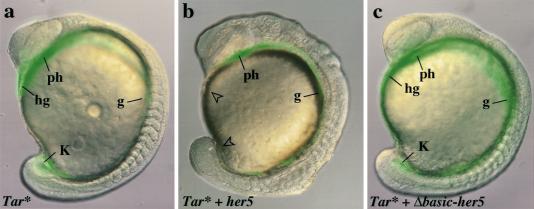
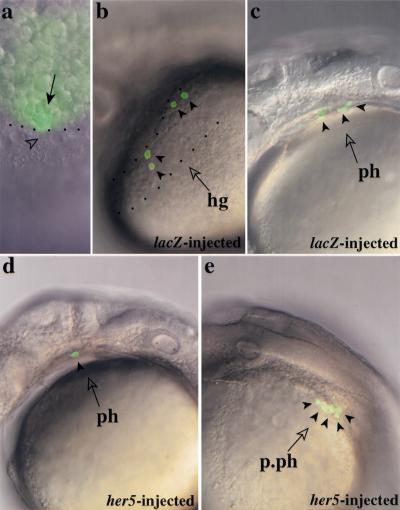
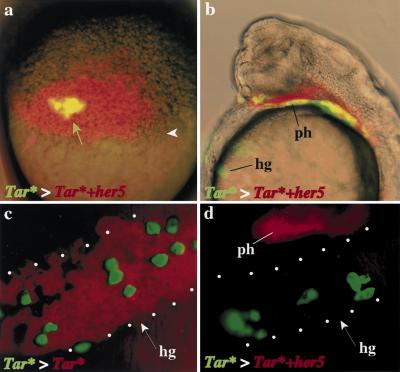
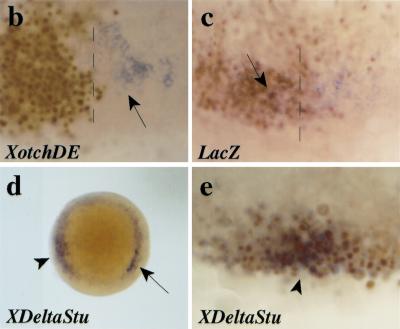
During embryonic development in vertebrates, the endoderm becomes patterned along the anteroposterior axis to produce distinct derivatives. How this regulation is controlled is not well understood. We report that the zebrafish hairy/enhancer of split [E(spl)]-related gene her5 plays a critical role in this process. At gastrulation, following endoderm induction and further cell interaction processes including a local release of Notch/Delta signaling, her5 expression is progressively excluded from the presumptive anterior- and posteriormost mesendodermal territories to become restricted to an adjacent subpopulation of dorsal endodermal precursors. Ectopic misexpressions of wild-type and mutant forms of her5 reveal that her5 functions primarily within the endodermal/endmost mesendodermal germ layer to inhibit cell participation to the endmost-fated mesendoderm. In this process, her5 acts as an active transcriptional repressor. These features are strikingly reminiscent of the function of Drosophila Hairy/E(spl) factors in cell fate decisions. Our results provide the first model for vertebrate endoderm patterning where an early regulatory step at gastrulation, mediated by her5 controls cell contribution jointly to the anterior- and posteriormost mesendodermal regions.


Figures

Figure 1
Figure 1
her5 is expressed in a subset of presumptive endodermal/mesendodermal cells at gastrulation. (a) Simplified fate map of the endoderm and mesendoderm at early gastrulation (from Shih and Fraser 1995; Cooper and D'Amico 1996; Melby et al. 1996; Warga and Nüsslein-Volhard 1999). The presumptive territories at the shield stage (left) and their derivatives at the 15-somite stage (right) (lateral views, dorsal to the right) are color-coded, and cell movements are indicated by arrows. her5 and sqt expression revealed by in situ hybridization (blue) in whole-mount gastrulae (b–f) and on the corresponding parasagittal sections (g–k) at the stages indicated (lower right corner), anterior to the top (white arrowheads point to the blastoderm margin). From 30% epiboly on, her5 (large arrows on b–e,g–j) is expressed in a subpopulation of dorsal deep cells (the small arrow indicates the dorsal midline), it becomes restricted to dorsal endodermal precursors immediately following the shield stage. her5-positive cells are located in direct apposition to the yolk syncitial layer (g–j). From 70% epiboly, her5 expression is also turned on in the presumptive mid-hindbrain (dots in e, bracket in j). At that stage, her5-positive endodermal precursors are restricted to the prechordal embryonic area. At the shield stage, sqt expression selectively labels forerunner cells (brackets in f), and the her5- and sqt-positive domains are adjacent and nonoverlapping (cf. c and f,h and k). her5 (blue) and gsc (red) expression at shield (l) and 60% epiboly (m,n) stages (m, dorsal view, anterior to the top; l,n, sections of the prechordal plate, dorsal to the right; contrary to sections g–k, l and n are cross-sections, oriented vertically). her5 (large arrows) and gsc expression overlap in the lateral aspects of the organizer at the shield stage, but are exclusive by 60% epiboly. In m, the medial her5-expressing cells are located under the gsc-positive prechordal plate. (o) Schematic of the spatial relationship of her5 (open blue domains), gsc (red), and sqt (brown) expression patterns at the shield (top) and 60% epiboly (bottom) stages (dorsal views).(f) forerunner cells and derivatives; (g) gut precursors; (hg) hatching gland; (n) notochord; (ph) pharyngeal precursors; (pp) prechordal plate; (y) yolk.
Figure 2
Figure 2
her5 controls the number of cells specified to the anterior- and posterior-most mesendoderm during gastrulation. (a) Wild-type and mutant forms of her5 (red; basic DNA-binding domain; black, HLH dimerization domain; yellow, WRPW carboxy-terminal tetrapeptide; green, VP16 activation domain). (b–q) Embryos were injected at the one-cell stage with capped RNAs as indicated above each boxed area, and probed at shield-60% epiboly (b–m) or 90% epiboly (n–q) with the genes indicated on each panel (color-coded). Dorsal views, anterior to the top, except in m (side views; d, dorsal side) and q (flat-mounts of the embryos in p, anterior to the left). her5 misexpressions inhibit gsc, sqt, and hgg1 expression (c,g,o). In n–o, hlx1 labels the posterior part of the prechordal plate, so most of the prechordal plate is missing in her5-injected embryos. Conversely, Δbasic–her5 and her5–VP16 increase the number of cells expressing gsc and sqt (d,e,h,i, arrowheads). The effect of her5–VP16 perdures and induces 2.5 times more hgg1-positive cells at late gastrulation (p,q; cf. control and her5–VP16-injected embryos on the left and right of each panel, respectively). The endoderm fated to intermediate anteroposterior positions (k–m, arrows) is not significantly affected; neither are notochordal precursors [medial expression of ntl (c) and axial (k–m)] (open arrowheads; data not shown).
Figure 3
Figure 3
her5 misexpression impairs the formation of the anterior- and posterior-most mesendodermal derivatives. Embryos were injected into a dorsal marginal blastomere at the 16-cell stage with 6 pg of lacZ (a,c,e) or 6 pg of lacZ + 1–3 pg of her5 RNAs (b,d,f) and 2000S rhodamine dextran (anterior to the left). At 36 hr, her5-injected embryos lack hatching gland (arrowhead in a) and display synopthalmia (cyc) (cf. a and b). Embryos were injected into a dorsal marginal blastomere at the 16-cell stage with 6 pg of lacZ (c,e,f) or 6 pg of lacZ + 1–3 pg of her5 RNAs (d,f,h) and 2000S rhodamine dextran, and tail development was observed at 8 somites (c,d) (bright field, dorsal views) or 48 hr (e–h) (bright field and fluorescence views, lateral views; posterior to the right). Kupffer's vesicle (K, arrowheads) (c,d) and forerunner derivatives in the tail fin mesenchyme (g,h, arrowheads) are absent upon her5 expression. The notochord (n) is never affected (cf. c and d, e and f). Embryos were injected in a lateral marginal blastomere at the 16-cell stage with 5 pg of GFP (i) or 5 pg of GFP + 0.5 pg of her5–VP16 (j) RNAs. Composite fluorescent and bright field images are shown. At 24 hr, her5–VP16 has induced the development of forerunner derivatives (j, arrowheads) from the lateral margin, which normally never contributes to this cell population (see i). Other endodermal domains (pharynx, white arrows; hatching gland, black arrows) are unaffected. (hg) hatching gland; (K) Kupffer's vesicle; (n) notochord.
Figure 4
Figure 4
her5 misexpression does not affect intermediate endodermal derivatives. Embryos were injected into a dorsolateral (a–c) or lateral (d–f) blastomere at the 16-cell stage with 4.5 pg of her5 + 5 pg of GFP mRNAs, and are observed at 72 hr. (a,b,d,e) Bright field and fluorescence whole-mount views, anterior to the left. (c,f) Cross-sections at the levels indicated, with GFP protein revealed by immunocytochemistry (brown). The progeny of the injected blastomere (arrows) contributed normally to the pharyngeal pouches (a–c) and gut derivatives (d–f). (f) Cell labeling in the swim bladder (area surrounded by filled dots; open dots line the intestine proper).
Figure 5
Figure 5
her5 misexpression in cells fated to the endoderm and endmost mesendoderm prevents their contribution to the endmost embryonic domains. Composite fluorescent and bright field views are shown, anterior to the left. (a–c) 15-Somite stage. Embryos were injected into one marginal blastomere at the 16-cell stage with: 0.06 pg of Tar* (a), 0.06 pg of Tar* + 3 pg of her5 (b), 0.06 pg of Tar* + 3 pg of Δbasic–her5 RNAs (c), and 2000S fluorescein dextran. A complete anteroposterior set of endodermal derivatives (green) is induced by Tar* (a) and Tar* + Δbasic–her5 (c). (b) Tar* + her5-injected cells (green) contribute to intermediate endoderm [(ph) pharynx; (g) presumptive gut] but not the anteriormost [(hg) hatching gland] and posteriormost [(K) Kupffer's vesicle] domains (open arrowheads in b).
Figure 6
Figure 6
her5 expression biases cell fate choice within the endoderm/mesendoderm. (a) Fate mapping technique. Single dorsal blastomeres (arrow) of the most marginal row were labeled at 40% epiboly by uncaging photoactivatable Fluorescein DMNB with a microlaser beam (dots indicate the embryonic margin and the arrowhead points to a nucleus of the yolk syncitial layer). (b,c) Fate acquired by dorsal endomesendodermal precursors in wild-type embryos. Most progenitors contributed cells to both the hatching gland (hg) delimited by dots in b, and pharyngeal endoderm (ph) (c). Each arrowhead points to a labeled cell. (d,e) Fate acquired by dorsal endomesendodermal precursors under conditions of her5 overexpression. Most progenitors contributed to an increased number of pharyngeal (ph) or postpharyngeal (p.ph) endodermal cells only, whereas the hatching gland was populated only rarely. Two different embryos are shown, each arrowhead points to a labeled cell. Four other labeled cells are out of focus and thus not visible on the embryo in d.
Figure 7
Figure 7
her5 acts cell autonomously on the anteriormost mesendoderm. (a) Grafting strategy. Tar* + GFP-expressing cells (green arrow) were grafted at the sphere stage within host embryos expressing either Tar* (c) or Tar* + her5 (a,b,d) (also labeled with 2000S rhodamine dextran, red arrow) at the blastoderm margin (white arrowhead). (b–d) Host embryos at 24 hr, c and d are frontal fluorescence views of the hatching gland region (delimited by dots), b is a side view of the embryo in c, with fluorescence and bright field images superimposed. Independent of the nature of the host patch, the grafted cells (green) participate equally well to the host hatching gland at 24 hr (cf. c and d). Tar* + her5-positive host cells (red in b,d) do not populate the hatching gland (cf. c and d) but participate normally to the pharynx (b, d). The superposition of green with red cells appears yellow in a,b. (hg) hatching gland; (ph) pharynx.
Figure 8
Figure 8
her5 expression requires positive cell interactions and an inhibition of Notch/Delta signaling. (a) The induction of her5 by Tar* requires positive cell interactions. RNA was extracted from whole embryos (WE, 1–3) or dissociated embryos (DE, 4–5) injected with 1 pg of Tar* RNA (2,4) or 100 pg of GFP RNA (3,5), and subsequently processed for RT–PCR. Elf1 serves as a loading control. Lanes 1 and 6 are samples from noninjected embryos treated with or without reverse transcriptase. (Endodermal) Expression of her5 is not induced upon Tar* injection when the cells of the injected embryos are dissociated; in contrast, gsc induction by Tar* is cell autonomous (cf. lanes 2 and 4 in each case). The basal level of her5 expression, maintained in dissociated cells (lane 5), probably corresponds to remnants of the early ubiquitous (nonendodermal) phase of her5 expression (see text). (b–e) Embryos were injected at the 16-cell stage into a marginal blastomere with 2 pg of capped XotchDE + 3 pg of lacZ RNAs (b), 3 pg of lacZ RNA (c), or 2 pg of XDeltaStu + 3 pg of lacZ RNAs (d,e), and tested for her5 (in situ hybridization, blue) and betagalactosidase (immunocytochemistry, brown nuclei) (except in d) expressions at the shield stage. (a–c, e) Flat-mounts of the injected areas; (d) animal pole view of the embryo shown in e, photographed prior to betagalactosidase detection. The injected areas in b,c overlapped with the endogenous axis (dorsal midline indicated by the broken line), whereas they are ventrally located in d,e. Endogenous her5 expression (arrows in b–d) is inhibited by XotchDE (cf. b with c where no inhibition is observed following expression of lacZ alone). In contrast, following XDeltaStu misexpression, her5 induction (arrowheads in d,e) occurs in deep cells of the margin (d), which derive from the injected blastomere (cf. blue and brown in e).
Figure 8
Figure 8
her5 expression requires positive cell interactions and an inhibition of Notch/Delta signaling. (a) The induction of her5 by Tar* requires positive cell interactions. RNA was extracted from whole embryos (WE, 1–3) or dissociated embryos (DE, 4–5) injected with 1 pg of Tar* RNA (2,4) or 100 pg of GFP RNA (3,5), and subsequently processed for RT–PCR. Elf1 serves as a loading control. Lanes 1 and 6 are samples from noninjected embryos treated with or without reverse transcriptase. (Endodermal) Expression of her5 is not induced upon Tar* injection when the cells of the injected embryos are dissociated; in contrast, gsc induction by Tar* is cell autonomous (cf. lanes 2 and 4 in each case). The basal level of her5 expression, maintained in dissociated cells (lane 5), probably corresponds to remnants of the early ubiquitous (nonendodermal) phase of her5 expression (see text). (b–e) Embryos were injected at the 16-cell stage into a marginal blastomere with 2 pg of capped XotchDE + 3 pg of lacZ RNAs (b), 3 pg of lacZ RNA (c), or 2 pg of XDeltaStu + 3 pg of lacZ RNAs (d,e), and tested for her5 (in situ hybridization, blue) and betagalactosidase (immunocytochemistry, brown nuclei) (except in d) expressions at the shield stage. (a–c, e) Flat-mounts of the injected areas; (d) animal pole view of the embryo shown in e, photographed prior to betagalactosidase detection. The injected areas in b,c overlapped with the endogenous axis (dorsal midline indicated by the broken line), whereas they are ventrally located in d,e. Endogenous her5 expression (arrows in b–d) is inhibited by XotchDE (cf. b with c where no inhibition is observed following expression of lacZ alone). In contrast, following XDeltaStu misexpression, her5 induction (arrowheads in d,e) occurs in deep cells of the margin (d), which derive from the injected blastomere (cf. blue and brown in e).

References

    1. Alexander J, Stainier DYR. A molecular pathway leading to endoderm formation in zebrafish. Curr Biol. 1999;9:1147–1157. - PubMed
    1. Appel B, Fritz A, Westerfield M, Grunwald DJ, Eisen JS, Riley BR. Delta-mediated specification of midline cell fates in zebrafish embryos. Curr Biol. 1999;9:247–256. - PubMed
    1. Barolo S, Levine M. Hairy mediates dominant repression in the Drosophila embryo. EMBO J. 1997;16:2883–2891. - PMC - PubMed
    1. Bierkamp C, Campos-Ortega JA. A zebrafish homologue of the Drosophila neurogenic gene Notch and its pattern of transcription during early embryogenesis. Mech Dev. 1993;43:87–100. - PubMed
    1. Cho KW, Blumberg B, Steinbeisser H, de Robertis EM. Molecular nature of Spemann's organizer: The role of the Xenopus homeobox gene goosecoid. Cell. 1991;20:1111–1120. - PMC - PubMed

Publication types

LinkOut - more resources