. 2000 Jul-Aug;7(4):404-15.
doi: 10.1136/jamia.2000.0070404.

PathMaster: content-based cell image retrieval using automated feature extraction

Affiliations

PathMaster: content-based cell image retrieval using automated feature extraction

M E Mattie et al. J Am Med Inform Assoc. 2000 Jul-Aug.

Abstract

Objective: Currently, when cytopathology images are archived, they are typically stored with a limited text-based description of their content. Such a description inherently fails to quantify the properties of an image and refers to an extremely small fraction of its information content. This paper describes a method for automatically indexing images of individual cells and their associated diagnoses by computationally derived cell descriptors. This methodology may serve to better index data contained in digital image databases, thereby enabling cytologists and pathologists to cross-reference cells of unknown etiology or nature.

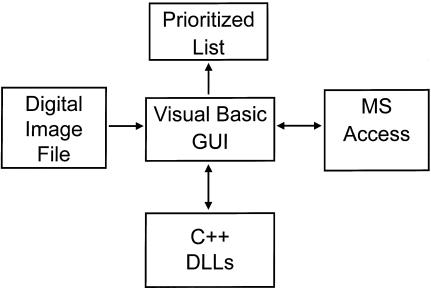
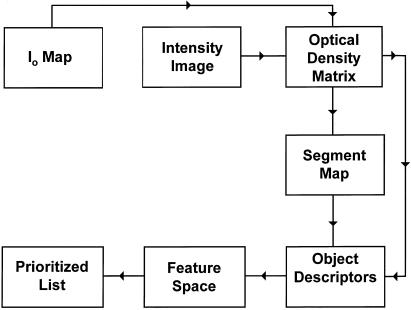
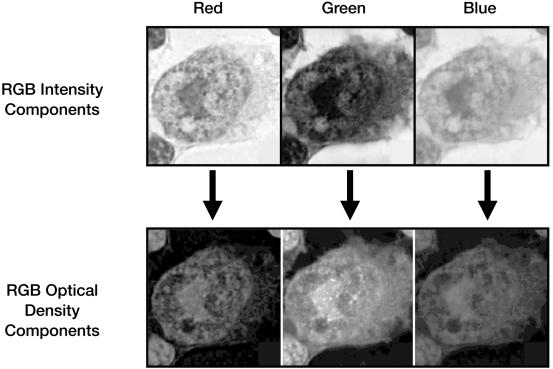
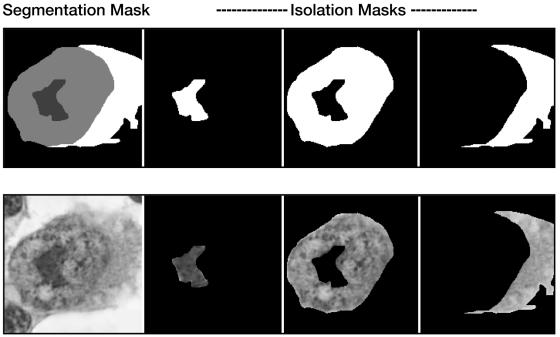
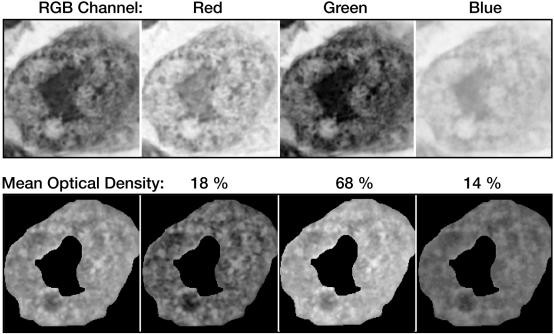
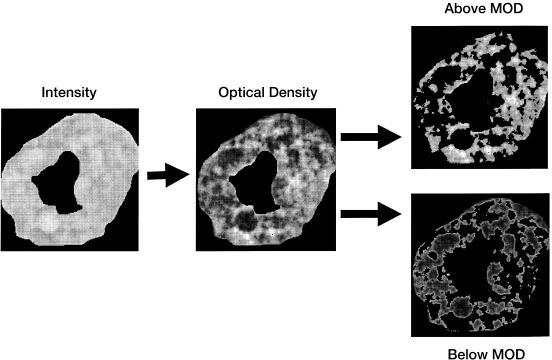
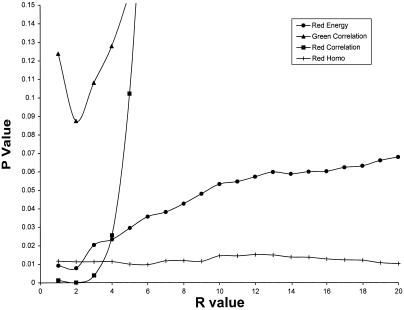
Design: The indexing method, implemented in a program called PathMaster, uses a series of computer-based feature extraction routines. Descriptors of individual cell characteristics generated by these routines are employed as indexes of cell morphology, texture, color, and spatial orientation.

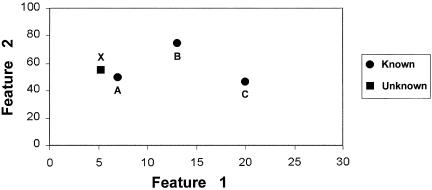
Measurements: The indexing fidelity of the program was tested after populating its database with images of 152 lymphocytes/lymphoma cells captured from lymph node touch preparations stained with hematoxylin and eosin. Images of "unknown" lymphoid cells, previously unprocessed, were then submitted for feature extraction and diagnostic cross-referencing analysis.

Results: PathMaster listed the correct diagnosis as its first differential in 94 percent of recognition trials. In the remaining 6 percent of trials, PathMaster listed the correct diagnosis within the first three "differentials."

Conclusion: PathMaster is a pilot cell image indexing program/search engine that creates an indexed reference of images. Use of such a reference may provide assistance in the diagnostic/prognostic process by furnishing a prioritized list of possible identifications for a cell of uncertain etiology.


Figures

Figure 1
Figure 1
PathMaster is composed of an aggregate of independent algorithms that are orchestrated by a Visual Basic graphical user interface (GUI). Note: MS indicates Microsoft; DLLs, dynamically linked libraries.
Figure 2
Figure 2
The extraction and comparison of cell features are accomplished by several conversion and analytic routines. Since intensity values of these matrixes vary with both the incident light intensity (Io) and the optical density of the specimen, each intensity matrix is converted to an optical density matrix. Cell descriptors that are extracted include colorimetric, multi-resolution textural, and domain-specific morphologic parameters. Descriptors are then used as coordinates to map the characteristics of each cell to a position in feature space. When an unknown cell is submitted for evaluation, the distance between its position and the positions that characterize other cells in feature space are calculated. These distances are used to generate an ordered list of matches.
Figure 3
Figure 3
Intensity images are resolved into their red, green, and blue (RGB) components for analysis. During analysis, each RGB component is addressed as a gray-level matrix.
Figure 4
Figure 4
Intensity values of an image vary with both the incident light intensity and the optical density of the specimen. To control for variations in incident intensity, the RGB component matrixes of an image are converted to optical density matrixes. These matrixes are used for all subsequent cytometric calculations.
Figure 5
Figure 5
Image segmentation. Binary isolation masks are generated for each region, including cytoplasm, nucleus, and nucleolus. Isolation masks are used by processing routines to identify individual segments to be analyzed.
Figure 6
Figure 6
Mean optical density of nucleus. Optical density descriptors are computed for all three (RGB) color channels. The mean optical density is calculated across all three channels and is expressed as a percentage of the total density. The nucleus of this specimen is densest to green light.
Figure 7
Figure 7
Subsegmentation (blue channel). PathMaster subdivides the nucleus into regions of both high and low optical density. Ranges of high and low optical density are defined using the mean optical density (MOD) as a referent.
Figure 8
Figure 8
A simplified example of two-dimensional feature space. Descriptors are used as coordinates to map the characteristics of each cell catalogued in a database to a position in two-dimensional feature space (“known” cell types). The position in feature space that characterizes the cell to be cross-referenced is also plotted (“unknown” cell type). “Distances” between the unknown and known cell types are computed. A list of similar cell types and their associated reports are then generated in an order indicating their distance from the unknown cell type.
Figure 9
Figure 9
The statistical significance of differences between Markov descriptors of mantle cell nuclear texture and small cell lymphoma nuclear texture varies as a function of r, the radius with which the gray-level co-occurrence matrix was compiled. The P values of a Student t test are displayed. The r values are expressed as horizontal pixel distances. In the key, “Homo” indicates homogeneity.
Figure 10
Figure 10
A, The gray-level co-occurrence matrix (GLCM) calculated from the red channel intensity matrix, using an r value of 1. B, The same GLCM with its probability values plotted on a logarithmic scale. C and D, A filter is applied to zero values of GLCM elements whose coordinates satisfy the equation y = x, y = x - 1, and y = x + 1.
Figure 11
Figure 11
The P values of a subset of “modified” Markov descriptors differ from those of “standard” Markov descriptors. The statistical significance of several textural descriptors are improved by employing a GLCM filter. FOM indicates first order moment; Homo, homogeneity; Crrltn, correlation; Prom, prominence.

References

    1. O'Brien MJ. Sotnikov AV. Digital imaging in anatomic pathology [review]. Am J Clin Pathol. 1996;106(4 suppl 1): S25-32. - PubMed
    1. Tagare HD, Jaffe CC, Duncan J. Medical image databases: a content-based retrieval approach. J Am Med Inform Assoc. 1997;4: 184-98. - PMC - PubMed
    1. Niblack W. Query by image and video content: the QBIC system. IEEE Comput. 1995;28(9): 23-32.
    1. Wetzel AW, Andrews PL, Becich MJ, Gilbertson J. Computational aspects of pathology image classification and retrieval. J Supercomput. 1997;11: 279-93.
    1. Pentland A, Picard RW, Sclaroff S. Photobook: content-based manipulation of image databases. Int J Comput Vision. 1996;18(3): 233-54.

Publication types

MeSH terms