. 2000 Jul 18;97(15):8272-7.
doi: 10.1073/pnas.140225597.

Sensitive detection of DNA polymorphisms by the serial invasive signal amplification reaction

Affiliations

Sensitive detection of DNA polymorphisms by the serial invasive signal amplification reaction

J G Hall et al. Proc Natl Acad Sci U S A. .

Abstract

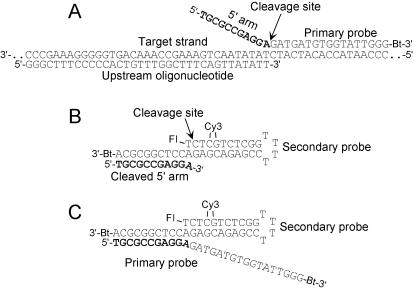
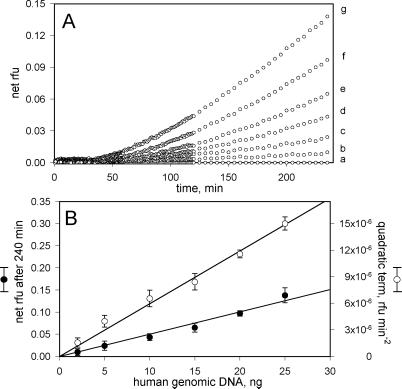
The invasive signal amplification reaction has been previously developed for quantitative detection of nucleic acids and discrimination of single-nucleotide polymorphisms. Here we describe a method that couples two invasive reactions into a serial isothermal homogeneous assay using fluorescence resonance energy transfer detection. The serial version of the assay generates more than 10(7) reporter molecules for each molecule of target DNA in a 4-h reaction; this sensitivity, coupled with the exquisite specificity of the reaction, is sufficient for direct detection of less than 1,000 target molecules with no prior target amplification. Here we present a kinetic analysis of the parameters affecting signal and background generation in the serial invasive signal amplification reaction and describe a simple kinetic model of the assay. We demonstrate the ability of the assay to detect as few as 600 copies of the methylene tetrahydrofolate reductase gene in samples of human genomic DNA. We also demonstrate the ability of the assay to discriminate single base differences in this gene by using 20 ng of human genomic DNA.


Figures

Figure 1
Figure 1
Schematic representations of the serial invasive signal amplification reaction (SISAR). (A) Proposed secondary structure of the overlapping substrate of the primary reaction. The upstream oligonucleotide and the primary probe are bound with the target strand so that the 3′ terminal nucleotide (T) of the upstream oligonucleotide overlaps with the terminal A-T base pair of the duplex formed between the probe and the target. The arrow indicates the site of cleavage, which generates a cleaved 5′ arm (shown in bold) that contains one nucleotide of the analyte-specific region (A) bearing a 3′-OH. (B) Proposed secondary structure of the overlapping substrate of the secondary reaction. The cleaved 5′ arm, produced in the primary reaction, forms an invasive substrate with target and probe strands linked into a hairpin structure called the secondary probe. Fl and Cy3 dyes, forming a FRET pair, are denoted by Fl and Cy3, respectively. Bt denotes a biotin modification. The arrow indicates the cleavage site. (C) The X-structure formed by the uncut primary probe and the secondary probe, which contributes to the background of the reaction (see text).
Figure 2
Figure 2
Dependence of the initial cleavage rate, d[S]/dt, of the secondary reaction on the concentration of added 5′ arms, [A], such as would be generated by cleavage in the primary reaction. The initial cleavage rates, measured as the concentration of the secondary probe cleaved by the enzyme in one minute (nM⋅min−1), were determined at different concentrations of 5′ arm. The reactions were run with 0.2 μM secondary probe, in the absence (●) or presence (○) of 0.4 μM primary probe, to measure the contribution of the primary probe to the background. The slopes of the lines give the cycling cleavage rate of the secondary reaction, α2, and the intercepts of the y axis indicate the contribution of background, kb, to the total rate. Error bars indicate the standard deviations obtained from the quadruplicate measurements with each sample.
Figure 3
Figure 3
Kinetics of the secondary probe cleavage in the serial invasive reaction. (A) Dependence of cleaved secondary probe concentration, [S], on time, t, of the reaction with (a) 0, (b) 0.01, (c) 0.03, (d) 0.1, (e) 0.3, (f) 1, and (g) 3 pM target strand. The dotted rectangle shows the data corresponding to the initial 10% of the cleavage as shown in B. (B) Initial kinetics of the secondary cleavage reaction (from A). Rate curve (a) was fit with a linear function, and rates for curves b–g were approximated by quadratic functions with the same linear term determined from (a); these data are summarized in Table 1.
Figure 4
Figure 4
Quantitative analysis of human genomic DNA. (A) Kinetics of the average net relative fluorescence signal (rfu) accumulated in the serial invasive reaction with the primary probe specific for the C at position 667 of the human MTHFR gene with (a) 0, (b) 2, (c) 5, (d) 10, (e) 15, (f) 20, and (g) 25 ng of homozygous C667 human genomic DNA. The net signal was determined as the difference between the signals obtained in the presence and in the absence of the target DNA. (B) Linearity of the net signal (●) and the quadratic kinetic term (○) with respect to the amount of human genomic DNA used in the 20-μl reaction after 4 and 2 h incubations, respectively. Error bars indicate the standard deviations obtained from the quadruplicate measurements with each sample.
Figure 5
Figure 5
Identification of single-nucleotide polymorphisms in nonamplified human genomic DNA. Time courses of the net relative fluorescence signal (rfu) generated by SISAR with the primary probes specific for either the T677 (●) or C677 (○) polymorphism of the human MTHFR gene. The amount of human genomic DNA used in each reaction was 20 ng, equivalent to ≈6,000 copies of the gene. (A) homozygous C677, (B) homozygous T677, and (C) heterozygous alleles.

References

    1. Lyamichev V, Mast A L, Hall J G, Prudent J R, Kaiser M W, Takova T, Kwiatkowski R W, Sander T J, de Arruda M, Arco D A, et al. Nat Biotechnol. 1999;17:292–296. - PubMed
    1. Lyamichev V, Brow M A, Varvel V E, Dahlberg J E. Proc Natl Acad Sci USA. 1999;96:6143–6148. - PMC - PubMed
    1. Kaiser M W, Lyamicheva N, Ma W, Miller C, Neri B, Fors L, Lyamichev V I. J Biol Chem. 1999;274:21387–21394. - PubMed
    1. Kwiatkowski R W, Lyamichev V, de Arruda M, Neri B P. Mol Diagn. 1999;4:353–364. - PubMed
    1. Richards E G. In: Handbook of Biochemistry and Molecular Biology. Fasman G D, editor. Vol. 1. Cleveland, OH: CRC; 1975. p. 597.

Publication types

LinkOut - more resources