. 2000 Jul 18;97(15):8219-24.
doi: 10.1073/pnas.140227997.

Two-dimensional infrared spectroscopy of peptides by phase-controlled femtosecond vibrational photon echoes

Affiliations

Two-dimensional infrared spectroscopy of peptides by phase-controlled femtosecond vibrational photon echoes

M C Asplund et al. Proc Natl Acad Sci U S A. .

Abstract

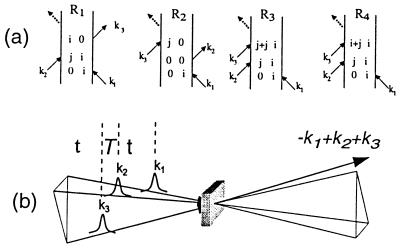
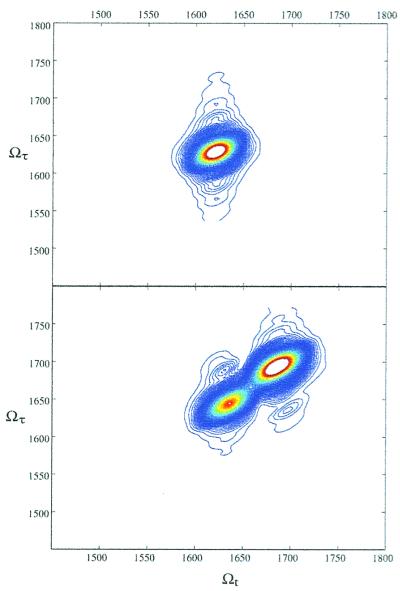
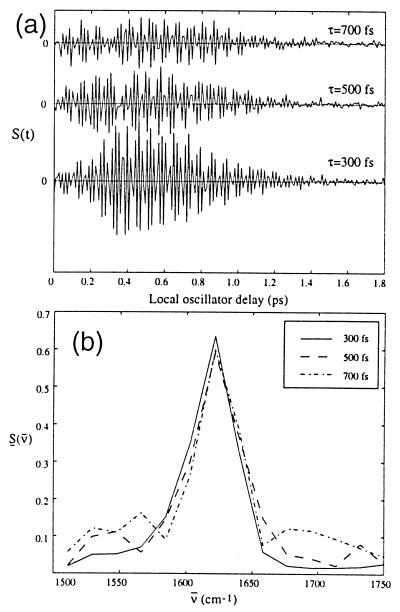
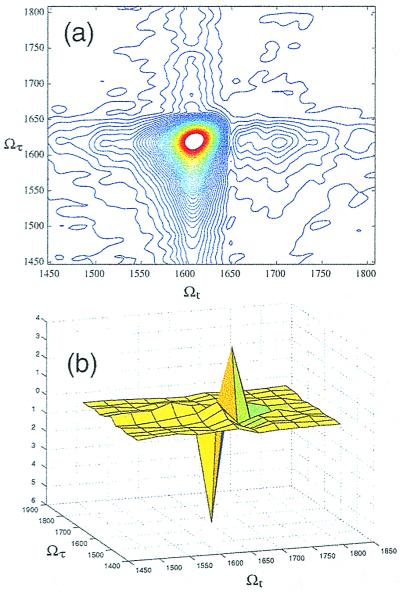
Two-dimensional infrared spectra of peptides are introduced that are the direct analogues of two- and three-pulse multiple quantum NMR. Phase matching and heterodyning are used to isolate the phase and amplitudes of the electric fields of vibrational photon echoes as a function of multiple pulse delays. Structural information is made available on the time scale of a few picoseconds. Line narrowed spectra of acyl-proline-NH(2) and cross peaks implying the coupling between its amide-I modes are obtained, as are the phases of the various contributions to the signals. Solvent-sensitive structural differences are seen for the dipeptide. The methods show great promise to measure structure changes in biology on a wide range of time scales.


Figures

Figure 1
Figure 1
(a) Feynmann diagrams for the third-order photon echo signal generated in the −k1+k2+k3 direction. i and j are the states a or b in a two-oscillator model, i + i is an overtone state, and i + j is a combination band. (b) Pulse sequence and geometry used in the generation of the three-pulse photon echo.
Figure 2
Figure 2
Simulations of absolute values of 2D-IR spectra, with a dephasing time of 900 fs, static inhomogeneous broadening of 9.5 cm−1, and an anharmonicity of 16 cm−1. (Upper) The 2D-IR spectrum for a single oscillator such as NMA-d, showing a single diagonal peak. (Lower) The 2D-IR spectrum for two oscillators, with a coupling of 5 cm−1.
Figure 3
Figure 3
Heterodyne photon echo signals for NMA-d in D2O at several values of time τ as a function of the time tLO. (a) Time-dependent interferograms of the echo signal. (b) Fourier transforms along the t axis showing the normalized spectra of the signal.
Figure 4
Figure 4
2D-IR spectra for NMA-d in D2O. (a) The absolute value of the 2D-IR spectrum, showing a single peak in both frequency dimensions. The asymmetry in the signal (compare simulation of Fig. 2) is sensitive to the choice of the center frequency of the laser pulses in relation to the resonances. (b) The real part of the 2D-IR spectrum, showing the fundamental and anharmonically shifted peaks, which have opposite signs.
Figure 5
Figure 5
A plot of the Wigner distribution for the NMA-d heterodyne echo signal, showing a time-dependent frequency shift in the echo field. For a real signal S(t), the Wigner distribution is defined as w(ν̄, t) = ∫−∞dt′S(t − t′/2)S(t + t′/2)eicν̄t′. The laser pulse shows a chirp-free, symmetric Wigner distribution.
Figure 6
Figure 6
Heterodyne photon echo signals for acyl-proline-NH2 in chloroform at several values of the time τ as a function of time tLO. (a) Time-dependent echo signal and (b) the Fourier transforms showing the spectra of the echo signal.
Figure 7
Figure 7
2D-IR spectra of acyl-proline-NH2, in (a) D2O, showing diagonal peaks at 1,620 and 1,670 cm−1, and (b) chloroform, which shows similar diagonal peaks, but also off-diagonal peaks. Because of the anharmonicity, the ellipses are not pointing exactly along the diagonal.
Figure 8
Figure 8
Spectral interferometry of the echo signal for acyl-proline in D2O, with the local oscillator delayed 1.5 ps from the echo signal. Shown are both the measured interferometric signal and the processed signal, which represents the emitted electric field of the echo. This signal shows peaks at 1,610 and 1,670 cm−1 corresponding to the frequencies of the two amide units.

References

    1. Hamm P, Lim M, Hochstrasser R M. J Phys Chem B. 1998;102:6123–6138.
    1. Hamm P, Lim M, DeGrado W F, Hochstrasser R M. Proc Natl Acad Sci USA. 1999;96:2036–2041. - PMC - PubMed
    1. Hamm P, Lim M, DeGrado W F, Hochstrasser R M. J Phys Chem A. 1999;103:10049–10053.
    1. Zhang W M, Chernyak V, Mukamel S. J Chem Phys. 1999;110:5011–5028.
    1. Munowitz M. Coherence and NMR. New York: Wiley; 1988.

Publication types

LinkOut - more resources