. 2000 Jul 18;97(15):8233-8.
doi: 10.1073/pnas.150220297.

Crystal structure of the HIV-1 integrase catalytic core and C-terminal domains: a model for viral DNA binding

Affiliations

Crystal structure of the HIV-1 integrase catalytic core and C-terminal domains: a model for viral DNA binding

J C Chen et al. Proc Natl Acad Sci U S A. .

Abstract

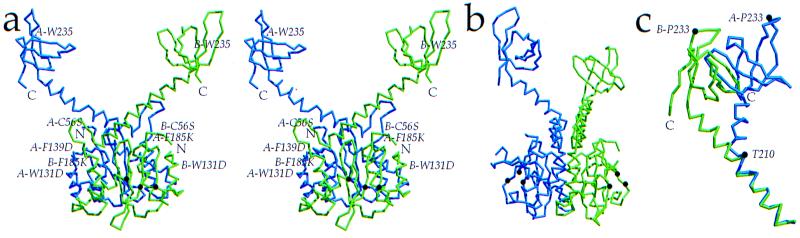
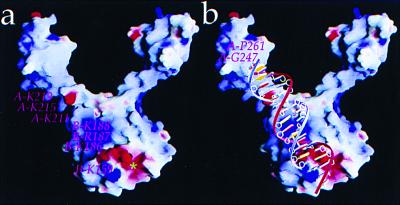
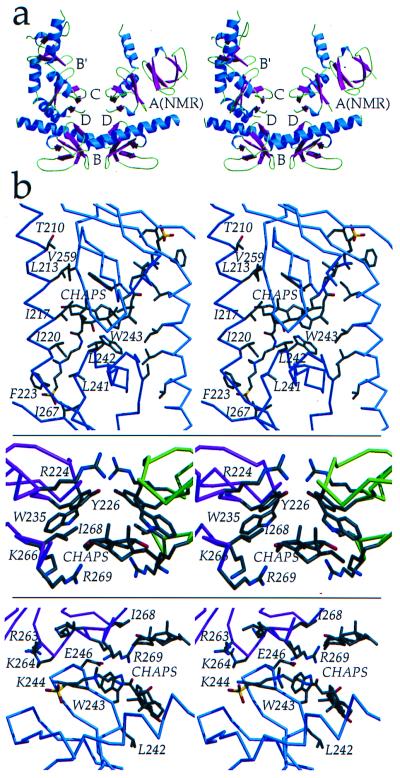
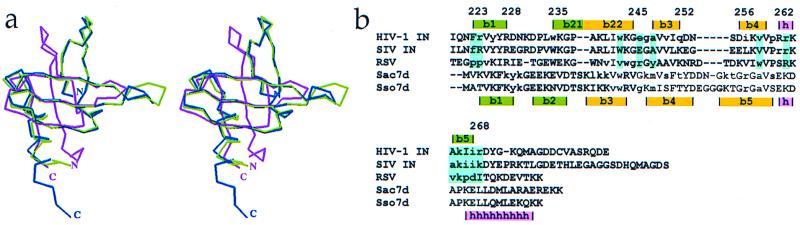
Insolubility of full-length HIV-1 integrase (IN) limited previous structure analyses to individual domains. By introducing five point mutations, we engineered a more soluble IN that allowed us to generate multidomain HIV-1 IN crystals. The first multidomain HIV-1 IN structure is reported. It incorporates the catalytic core and C-terminal domains (residues 52-288). The structure resolved to 2.8 A is a Y-shaped dimer. Within the dimer, the catalytic core domains form the only dimer interface, and the C-terminal domains are located 55 A apart. A 26-aa alpha-helix, alpha6, links the C-terminal domain to the catalytic core. A kink in one of the two alpha6 helices occurs near a known proteolytic site, suggesting that it may act as a flexible elbow to reorient the domains during the integration process. Two proteins that bind DNA in a sequence-independent manner are structurally homologous to the HIV-1 IN C-terminal domain, suggesting a similar protein-DNA interaction in which the IN C-terminal domain may serve to bind, bend, and orient viral DNA during integration. A strip of positively charged amino acids contributed by both monomers emerges from each active site of the dimer, suggesting a minimally dimeric platform for binding each viral DNA end. The crystal structure of the isolated catalytic core domain (residues 52-210), independently determined at 1.6-A resolution, is identical to the core domain within the two-domain 52-288 structure.


Figures

Figure 1
Figure 1
HIV-1 IN activities. A schematic diagram of HIV-1 IN activities depicts the double-stranded DNA viral genome at the top as parallel black lines with the terminal nucleotides CAGT. The conserved 3′ CA dinucleotide is underlined at each viral end. IN first acts in the cytoplasm to remove the two 3′ nucleotides (3′ processing), leaving a 2-nt overhang at each 5′ end. In the nucleus, IN mediates a concerted integration (strand transfer) by ligating each 3′ end of the viral DNA (looped structure) to the host DNA (striped lines). This generates a “gapped intermediate” with free viral 5′ ends that are repaired to generate the fully integrated provirus. The characteristic HIV-1 5-bp staggered strand transfer is depicted by the letters A-E in the target DNA, and the resulting 5-bp direct repeats (DR) of host DNA flanking the provirus are indicated.
Figure 2
Figure 2
Structure of HIV-1 IN52–288. (a) Stereoview of the HIV-1 IN52–288 dimer, composed of monomer A (blue) and monomer B (green). Monomer B catalytic residues D64, D116, and E152 are indicated (brown dots), and the N and C termini of each monomer are labeled. Immunologically critical residue W235 is located on the surface. Mutated residues C56S, W131D, F139D, and F185K are indicated, except for C280S, which is disordered. (b) The HIV-1 IN52–288 dimer rotated by 90° with respect to a. Catalytic residues are highlighted in brown. (c) Alignment of residues 195–210 in α6 demonstrates the kink at T210 that creates a ≈90° rotation of the C-terminal domains relative to one another as illustrated by the position of P233. Figure was generated by molscript (44) and raster3d (45).
Figure 3
Figure 3
Electrostatic potential map of the HIV-1 IN52–288 dimer. (a) The dimer orientation is the same as in Fig. 2a. Potentials range from −15/kT (red) to +15/kT (blue). The strip of positive charge (blue) coursing up and to the left contains residues from both monomers of the dimer, K211, K215, and K219 from monomer A and K159, K186, R187, K188 from monomer B. The active site pocket of monomer B (*) includes catalytic residues D64, D116, and E152. (b) An 18-bp viral DNA end is modeled onto the IN dimer with the positively charged residues in contact with the DNA phosphodiester backbone. The adenine base of the conserved viral 3′ CA dinucleotide contacts K159. Docking of DNA was done with midas (46). Figure was generated by grasp (47).
Figure 4
Figure 4
Electron density plots from the IN52–288 structure. (a) Plot of a simulated annealing composite omit map showing 2FoFc density contoured at 1 σ in a region of the HIV-1 IN52–288 catalytic core domain. The refined structure is superimposed on the density plot. (b) Plot of a 2FoFc map, contoured at 1.2 σ, around linking helix α6 and the C-terminal domain of monomer B. At the left is the cis-proline, P238, where β2 sharply changes direction and transitions between the two β-sheets within the C-terminal domain. Maps were generated by cns (20). Figure was generated by molscript (44) and locally written frodomol.
Figure 5
Figure 5
SH3–SH3 interactions. (a) The C-terminal domains within the IN52–288 dimer are 55 Å apart, but four different dimer-dimer contacts involving interactions between adjacent C-terminal domains, interfaces B, B′, C, and D, are found within the crystal. All four of these interfaces differ from interface A, which is found in the NMR structure of isolated C-terminal domains. Buried molecular surface areas for the interfaces are: B = 1,695 Å (2), B′ = 2,589 Å (2), C = 697 Å (2), D = 764 Å (2), and A(NMR) = 660 Å (2). β-strands (magenta), α-helices (blue), and loops (green) are color coded. (b) Interactions between adjacent C-terminal domains and protein-detergent (CHAPS) interactions are shown. (Top) Interface B, in an orientation rotated 90° relative to that in a. (Middle) Interface C. (Bottom) Interface D. Interfaces C and D are in an identical orientation as in a. Figure was generated by using molscript (44) and raster3d (45). Surface area was calculated by using surface (48).
Figure 6
Figure 6
Comparison of the SH3-like folds from HIV-1 IN, Sac7d, and Sso7d. (a) α-Carbon overlay of the HIV-1 IN C-terminal domain (magenta), Sac7d (green), and Sso7d (blue) structures demonstrates significant structural similarity. (b) Primary sequence alignment of the IN C-terminal domains from HIV-1, SIV, and RSV, and DNA-binding proteins Sac7d and Sso7d based on secondary structure (HIV-1 IN residue numbering). Secondary structural elements are highlighted. Yellow and green denote the β-strands contributing to the β-sandwich structure of the IN C-terminal domains, Sac7d, and Sso7d. Lowercase lettering indicates residues in IN that are involved in protein–protein interactions, and residues in Sac7d and Sso7d that are involved in protein-DNA interactions. Residues highlighted in cyan are involved in protein–protein contacts in at least two of the molecules.

References

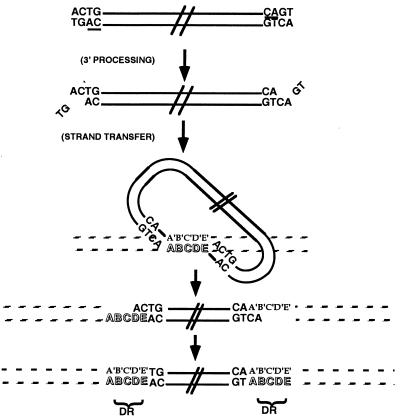
    1. Engelman A, Mizuuchi K, Craigie R. Cell. 1991;67:1211–1221. - PubMed
    1. Johnson M S, McClure M A, Feng D F, Gray J, Doolittle R F. Proc Natl Acad Sci USA. 1986;83:7648–7652. - PMC - PubMed
    1. Khan E, Mack J P, Katz R A, Kulkosky J, Skalka A M. Nucleic Acids Res. 1991;19:851–860. - PMC - PubMed
    1. Bushman F D, Engelman A, Palmer I, Wingfield P, Craigie R. Proc Natl Acad Sci USA. 1993;90:3428–3432. - PMC - PubMed
    1. Engelman A, Craigie R. J Virol. 1992;66:6361–6369. - PMC - PubMed

Publication types

LinkOut - more resources