. 2000 Jul 10;150(1):145-54.
doi: 10.1083/jcb.150.1.145.

Evidence that dynamin-2 functions as a signal-transducing GTPase

Affiliations

Evidence that dynamin-2 functions as a signal-transducing GTPase

K N Fish et al. J Cell Biol. .

Abstract

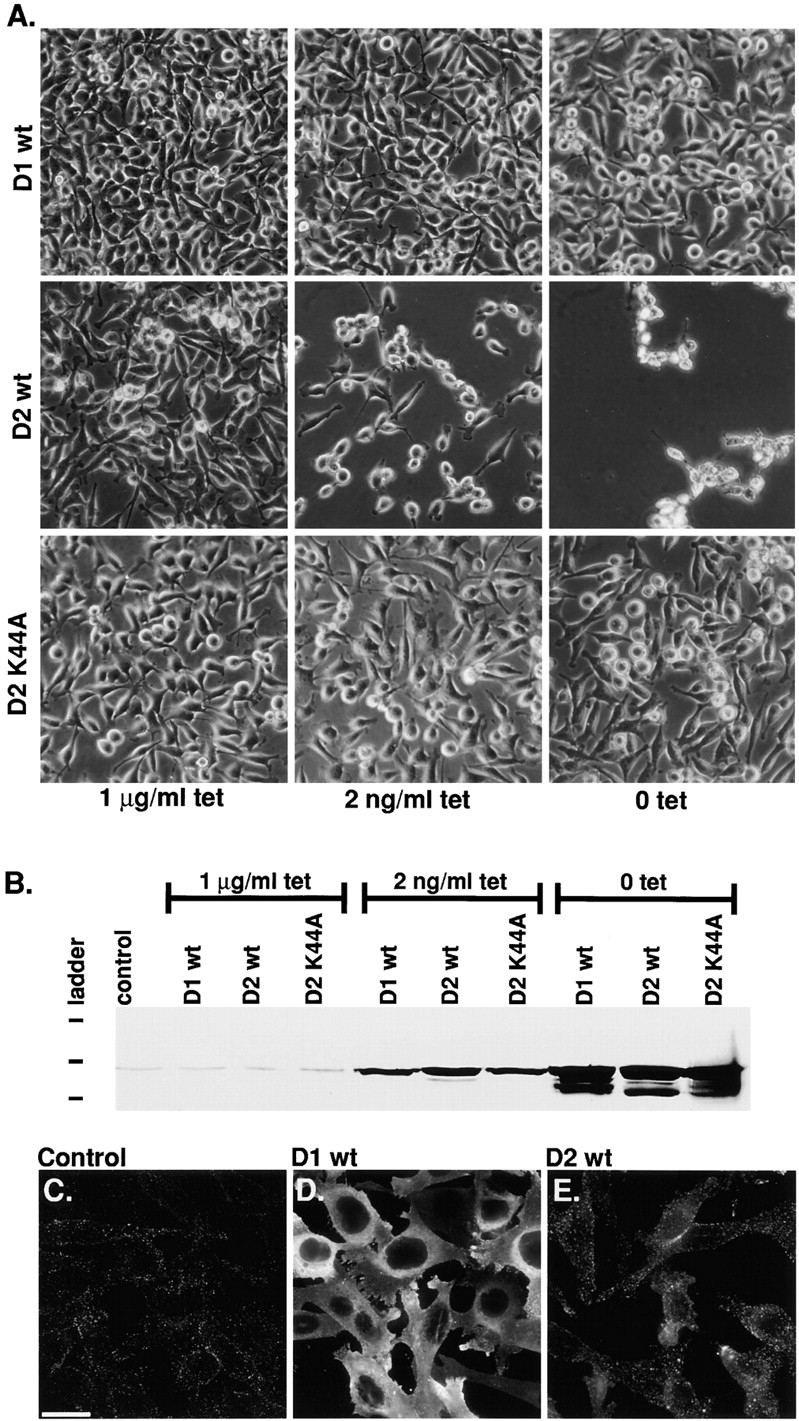
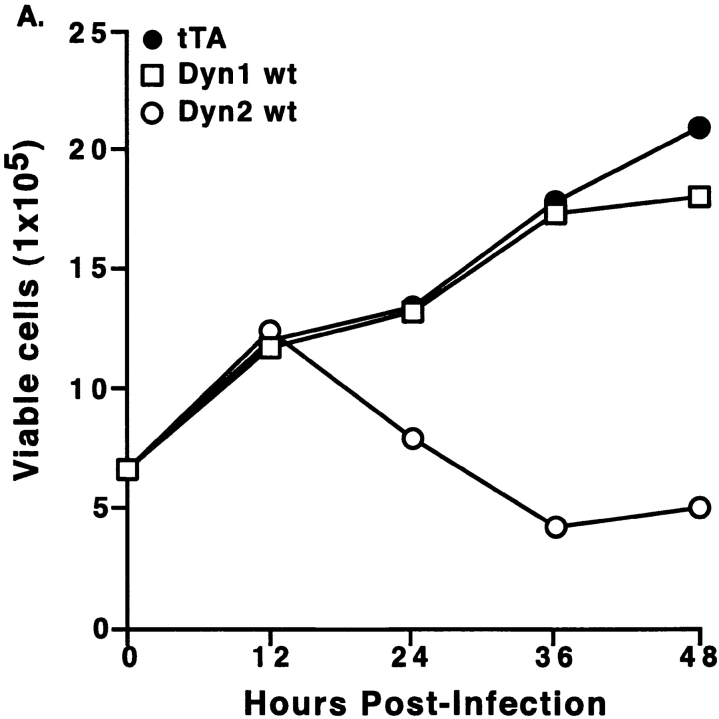
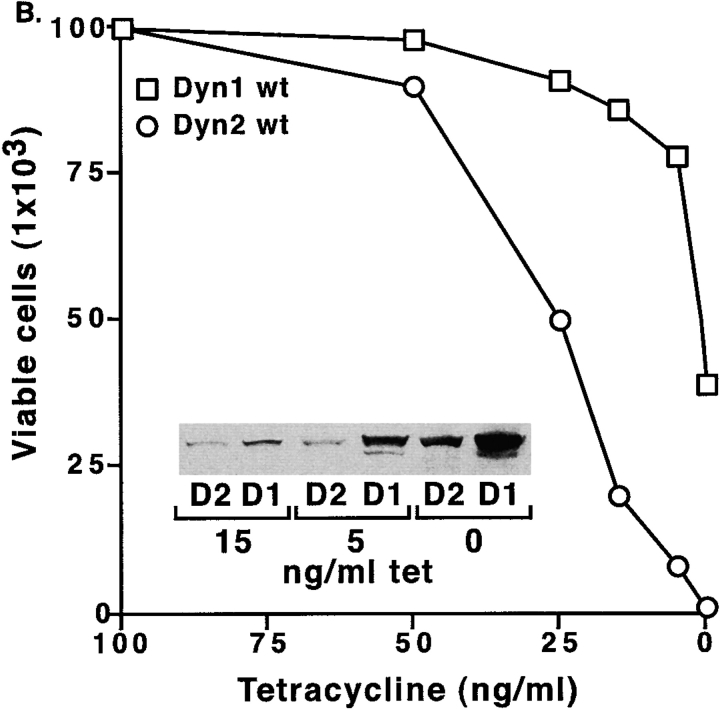
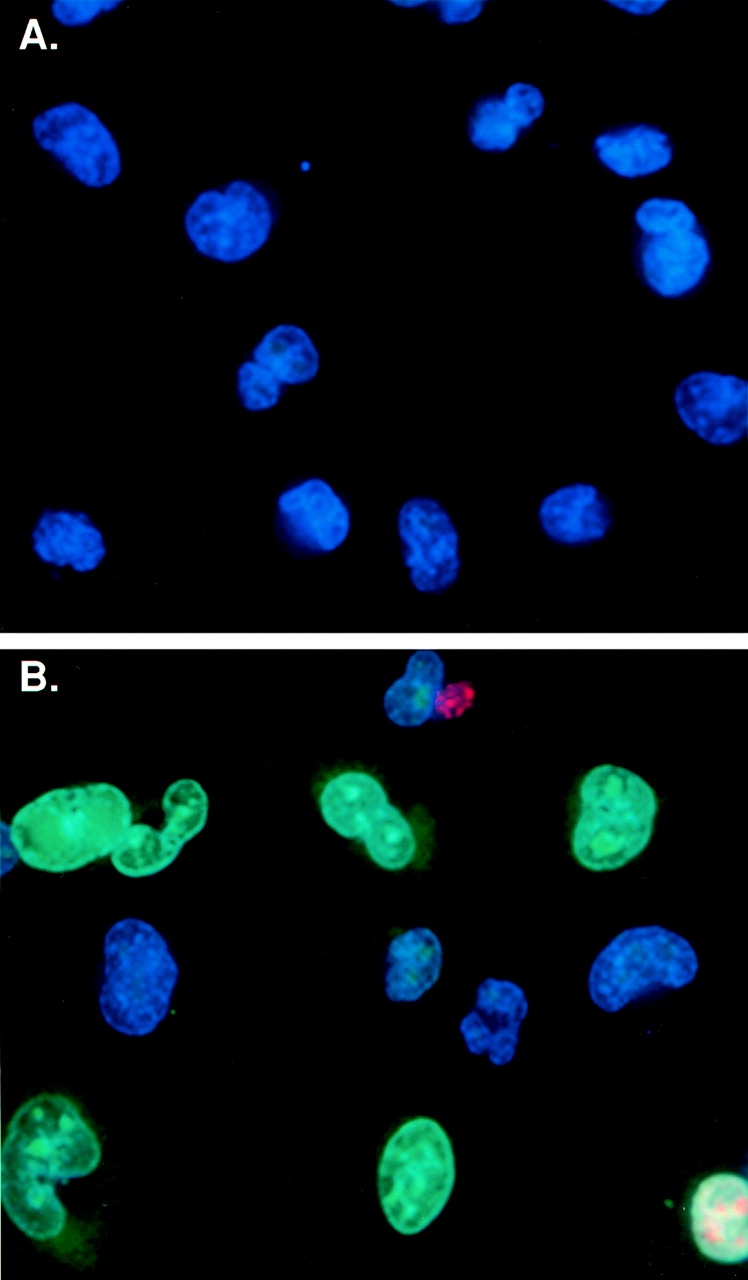
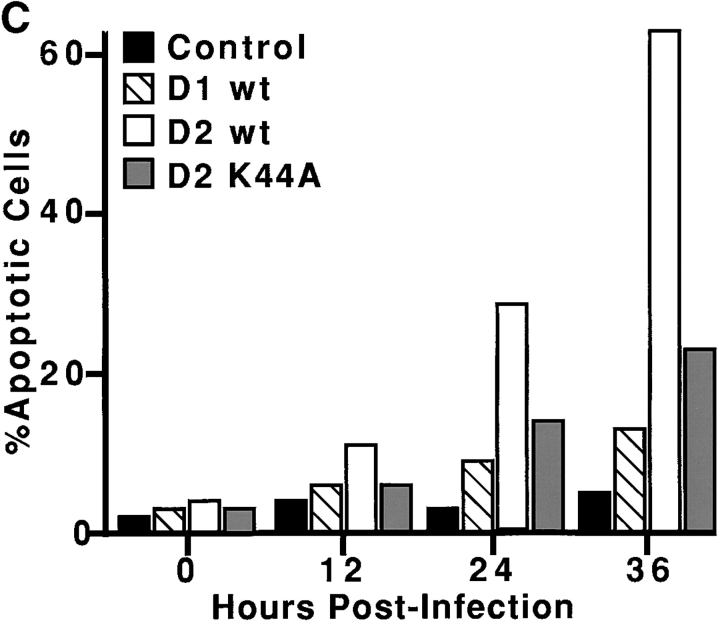
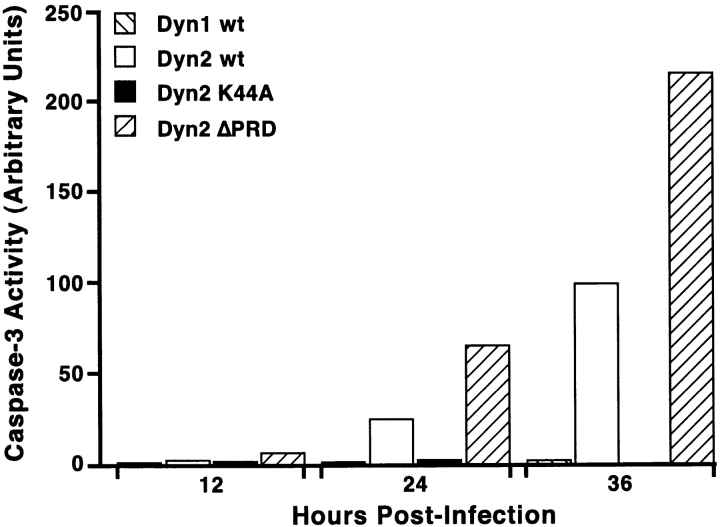
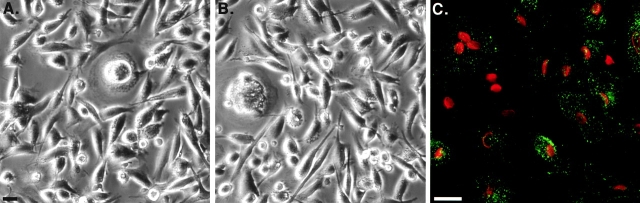
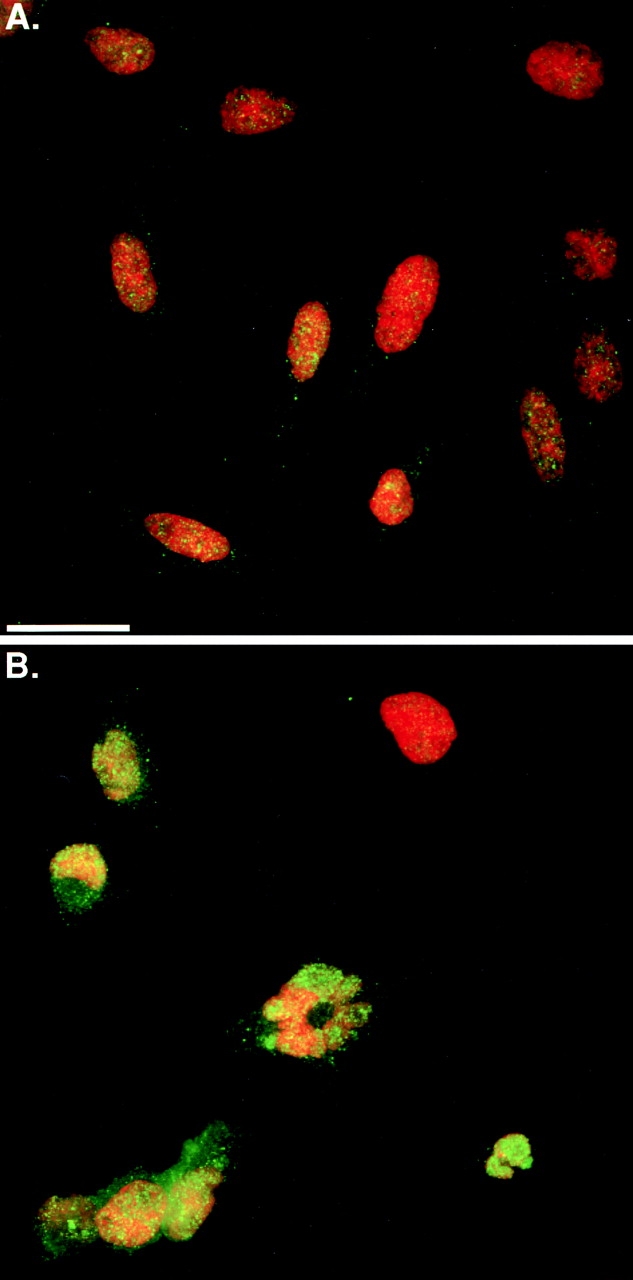
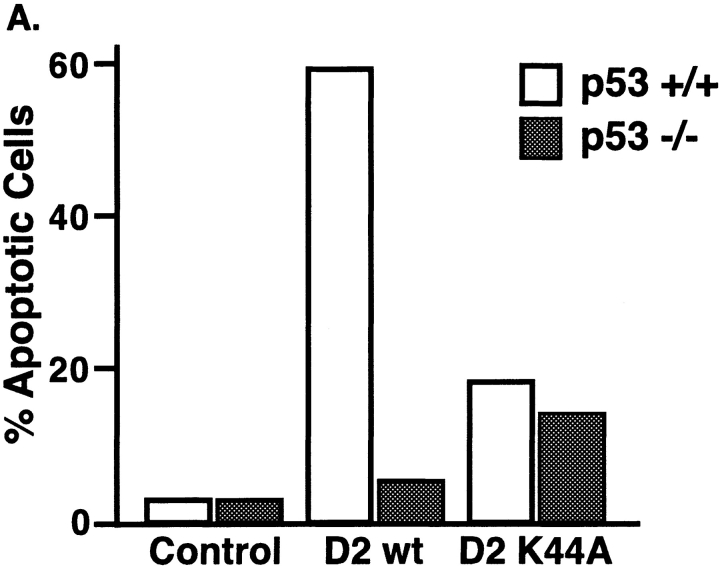
The role of dynamin GTPases in the regulation of receptor-mediated endocytosis is well established. Here, we present new evidence that the ubiquitously expressed isoform dynamin-2 (dyn2) can also function in a signal transduction pathway(s). A </=5-fold increase of dyn2 relative to endogenous levels activates the transcription factor p53 and induces apoptosis, as demonstrated by reduced cell proliferation, DNA fragmentation, and caspase-3 activation. Dyn2-triggered apoptosis occurs only in dividing cells and is p53 dependent. A mutant defective in GTP binding does not trigger apoptosis, indicating that increased levels of dyn2.GTP, rather than protein levels per se, are required to transduce signals that activate p53. A truncated dyn2 lacking the COOH-terminal proline/arginine-rich domain (PRD), which interacts with many SH3 domain-containing partners implicated in both endocytosis and signal transduction, triggers apoptosis even more potently than the wild-type. This observation provides additional support for the importance of the NH(2)-terminal GTPase domain for the apoptotic phenotype. All described effects are dyn2-specific because >200-fold overexpression of dyn1, the 70% identical neuronal isoform, has no effect. Our data suggest that dyn2 can act as a signal transducing GTPase affecting transcriptional regulation.


Figures

Figure 1
Figure 1
Dynamin-2 specifically induces cell toxicity in tTA HeLa cells. (A) Phase contrast micrographs of tTA-HeLa cells infected with an equivalent moi of adenovirus expressing either dyn1wt, dyn2wt, or dyn2K44A under control of a tetracycline-regulatable promoter, as described in Materials and Methods. After infection, cells were incubated for 36 h in media containing the indicated concentration of tetracycline. (B) Western blot analysis using the pan-dynamin antibody 748 showing endogenous dynamin-2 (detected in control lanes and in lanes where exogenous expression is suppressed in the presence of 1 μg/ml tet) and tetracycline-dependent expression levels of exogenous dyn1wt, dyn2wt, or dyn2K44A. (C–E) Immunofluorescence images of dynamin staining in uninfected tTA HeLa cells (C) or tTA HeLa cells infected with adenovirus encoding dyn1wt (D) or dyn2wt (E) and cultured for 24 h in the absence of tetracycline. Bar, 20 μm.
Figure 2
Figure 2
At low levels of expression, dynamin-2 specifically induces cell death. (A) Equal numbers of tTA-HeLa cells were infected with 10 moi of adenovirus expressing either dyn1wt(□), dyn2wt (○), or tTA (•). Cells were harvested at the indicated times postinfection and analyzed using Trypan blue exclusion to quantify cell viability. (B) Equal numbers of tTA-HeLa cells were infected with a high moi (500) which was chosen to detect some toxicity of adenoviruses encoding dyn1wt, and incubated in the presence of varying concentrations of tetracycline to regulate expression of dyn1wt (□) and dyn2wt (○). Cells were harvested 36 h postinfection and analyzed for viability by Trypan blue exclusion. The insert in B shows Western blot analysis of corresponding levels of dyn1 and dyn2 expression under these conditions detected using the pan-dynamin polyclonal antibody 748. Dyn1wt at an moi 500 in the absence of tetracycline is expressed ∼100-fold over endogenous dyn2 as quantified by densitometric measurements of Western blots.
Figure 2
Figure 2
At low levels of expression, dynamin-2 specifically induces cell death. (A) Equal numbers of tTA-HeLa cells were infected with 10 moi of adenovirus expressing either dyn1wt(□), dyn2wt (○), or tTA (•). Cells were harvested at the indicated times postinfection and analyzed using Trypan blue exclusion to quantify cell viability. (B) Equal numbers of tTA-HeLa cells were infected with a high moi (500) which was chosen to detect some toxicity of adenoviruses encoding dyn1wt, and incubated in the presence of varying concentrations of tetracycline to regulate expression of dyn1wt (□) and dyn2wt (○). Cells were harvested 36 h postinfection and analyzed for viability by Trypan blue exclusion. The insert in B shows Western blot analysis of corresponding levels of dyn1 and dyn2 expression under these conditions detected using the pan-dynamin polyclonal antibody 748. Dyn1wt at an moi 500 in the absence of tetracycline is expressed ∼100-fold over endogenous dyn2 as quantified by densitometric measurements of Western blots.
Figure 3
Figure 3
Dynamin-2–induced apoptosis detected by loss of membrane integrity. Subconfluent monolayers of tTA-HeLa cells were either uninfected or infected with adenovirus encoding either dyn1wt, dyn2wt, or dyn2K44A and incubated 24 h postinfection with the fluorescent DNA dyes, YO-PRO-1 (1 μM), propidium iodine (PI, 5 μg/ml) and Hoechst 33342 (10 μg/ml) for 10 min at 37°C as described in Materials and Methods. The immunofluorescence images shown are representative fields of adenovirally infected tTA-HeLa cells expressing dyn1wt (A) or dyn2wt (B) taken 24 h postinfection. Early apoptotic cells within the population with compromised plasma membrane integrity are labeled with YO-PRO-1® (green fluorescence). Cells at later stages of apoptosis and dead cells are labeled with the membrane impermeant dye, PI (red fluorescence). Hoechst, a cell permeant DNA dye (blue fluorescence), labels all cells in the population. Quantification of the number of early apoptotic cells (i.e., YO-PRO-1 positive), expressed as the percentage of viable cells (i.e., PI negative), at various times postinfection is shown in C. 100 cells were counted for each condition.
Figure 3
Figure 3
Dynamin-2–induced apoptosis detected by loss of membrane integrity. Subconfluent monolayers of tTA-HeLa cells were either uninfected or infected with adenovirus encoding either dyn1wt, dyn2wt, or dyn2K44A and incubated 24 h postinfection with the fluorescent DNA dyes, YO-PRO-1 (1 μM), propidium iodine (PI, 5 μg/ml) and Hoechst 33342 (10 μg/ml) for 10 min at 37°C as described in Materials and Methods. The immunofluorescence images shown are representative fields of adenovirally infected tTA-HeLa cells expressing dyn1wt (A) or dyn2wt (B) taken 24 h postinfection. Early apoptotic cells within the population with compromised plasma membrane integrity are labeled with YO-PRO-1® (green fluorescence). Cells at later stages of apoptosis and dead cells are labeled with the membrane impermeant dye, PI (red fluorescence). Hoechst, a cell permeant DNA dye (blue fluorescence), labels all cells in the population. Quantification of the number of early apoptotic cells (i.e., YO-PRO-1 positive), expressed as the percentage of viable cells (i.e., PI negative), at various times postinfection is shown in C. 100 cells were counted for each condition.
Figure 4
Figure 4
Dynamin-2–induced apoptosis detected by increased caspase-3 activity. tTA-HeLa cells infected with adenovirus encoding dyn1wt or dyn2wt or the dynamin mutants dyn2K44A and dyn2ΔPRD. Cells were harvested at the indicated times postinfection and viable cells were assayed for caspase-3 activity using the fluorescent substrate Ac-DEVD-AMC as described in Materials and Methods. For comparison of independent experiments, caspase-3 activity is plotted in arbitrary units setting dyn2wt at 36 h postinfection as 100 after substracting the background of tTA-infected cells. Representative data of three independent experiments are shown.
Figure 5
Figure 5
Nondividing cells are resistant to dynamin-2–induced apoptosis. At 8 d post differentiation, primary monocyte-derived macrophage cultures were coinfected with 100 moi each of Ad-Trans and either Ad-Dyn1wt (A) or Ad-Dyn2wt (B) recombinant adenoviruses. These infection conditions were required to obtain maximum efficiency of ∼60% of cells expressing HA-dynamin as detected immunofluorescence using 12CA5 (C). Bars, 20 μm.
Figure 6
Figure 6
Dynamin-2 increases nuclear staining for p53. 24 h after adenoviral infection tTA Hela cells expressing dyn1wt (A) or dyn2wt (B) were processed for immunostaining with p53-specific antibodies (green). Nuclei (red) were stained with Hoechst. p53 redistribution to the nucleus was observed in >90% of dynamin-2–expressing cells. Bar, 20 μm.
Figure 7
Figure 7
Dynamin-2–induced apoptosis is p53 dependent. (A) p53+/+ and p53−/− mouse embryo fibroblasts were infected with the indicated adenoviruses and incubated for 24 h before staining with the fluorescent DNA dye YO-PRO-1 (1 μM). Quantification of the number of early apoptotic cells (i.e., YO-PRO-1 positive), expressed as the percentage of viable cells (i.e., PI negative) is shown at 24 h postinfection. 100 cells were counted for each condition. (B) p53ts cells were grown at 37 or 32°C for 24 h and then infected with the indicated adenoviruses and incubated for a further 24 h at the same temperature. MTT conversion assays were used to measure cell proliferation and viability. The results are expressed as percent of uninfected control ± SD (n = 3).
Figure 7
Figure 7
Dynamin-2–induced apoptosis is p53 dependent. (A) p53+/+ and p53−/− mouse embryo fibroblasts were infected with the indicated adenoviruses and incubated for 24 h before staining with the fluorescent DNA dye YO-PRO-1 (1 μM). Quantification of the number of early apoptotic cells (i.e., YO-PRO-1 positive), expressed as the percentage of viable cells (i.e., PI negative) is shown at 24 h postinfection. 100 cells were counted for each condition. (B) p53ts cells were grown at 37 or 32°C for 24 h and then infected with the indicated adenoviruses and incubated for a further 24 h at the same temperature. MTT conversion assays were used to measure cell proliferation and viability. The results are expressed as percent of uninfected control ± SD (n = 3).

Similar articles

Cited by

References

    1. Ahn S., Maudsley S., Luttrell L.M., Lefkowitz R.J., Daaka Y. Src-mediated tyrosine phosphorylation of dynamin is required for beta2-adrenergic receptor internalization and mitogen-activated protein kinase signaling. J. Biol. Chem. 1999;274:1185–1188. - PubMed
    1. Altschuler Y., Barbas S.M., Terlecky L.J., Tang K., Hardy S., Mostov K.E., Schmid S.L. Redundant and distinct functions for dynamin-1 and dynamin-2 isoforms. J. Cell Biol. 1998;143:1871–1881. - PMC - PubMed
    1. Behl C., Davis J.B., Lesley R., Schubert D. Hydrogen peroxide mediates amyloid beta protein toxicity. Cell. 1994;77:817–827. - PubMed
    1. Blagosklonny M.V. Loss of function and p53 protein stabilization. Oncogene. 1997;15:1889–1893. - PubMed
    1. Budihardjo I., Holt O., Lutter M., Luo X., Wang X. Biochemical pathways of caspase activation during apoptosis. Annu. Rev. Cell Dev. Biol. 1999;15:269–290. - PubMed

Publication types

MeSH terms