. 2000 Jul 10;150(1):165-76.
doi: 10.1083/jcb.150.1.165.

Glutamate slows axonal transport of neurofilaments in transfected neurons

Affiliations

Glutamate slows axonal transport of neurofilaments in transfected neurons

S Ackerley et al. J Cell Biol. .

Abstract

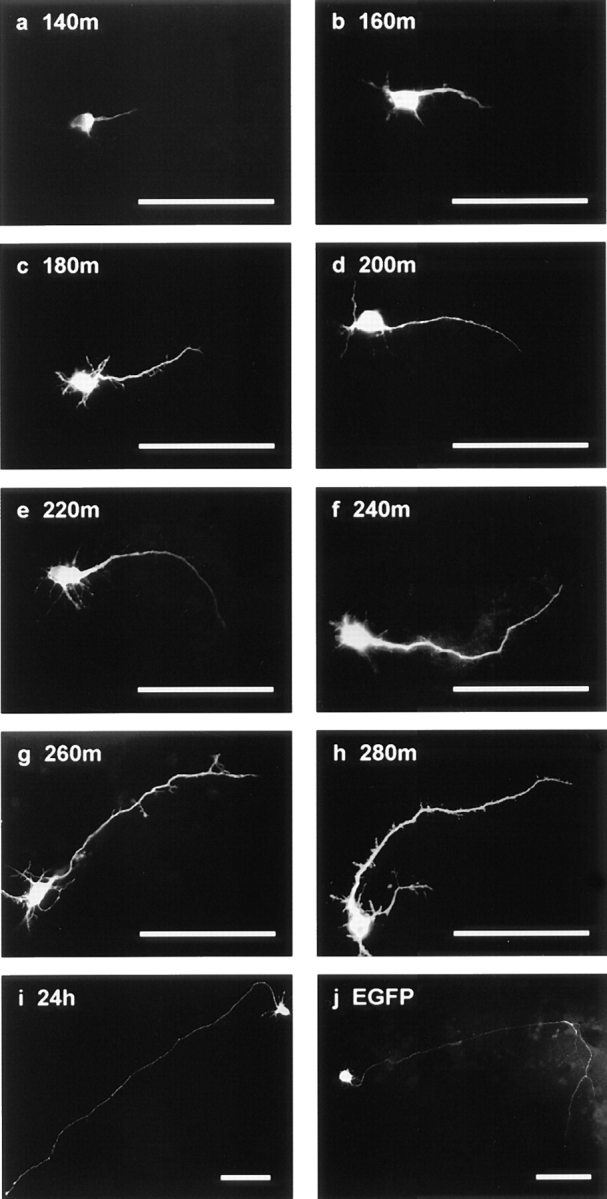
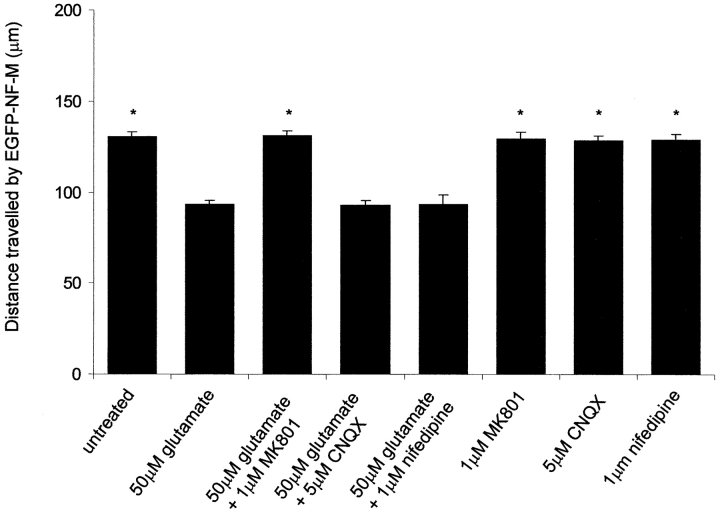
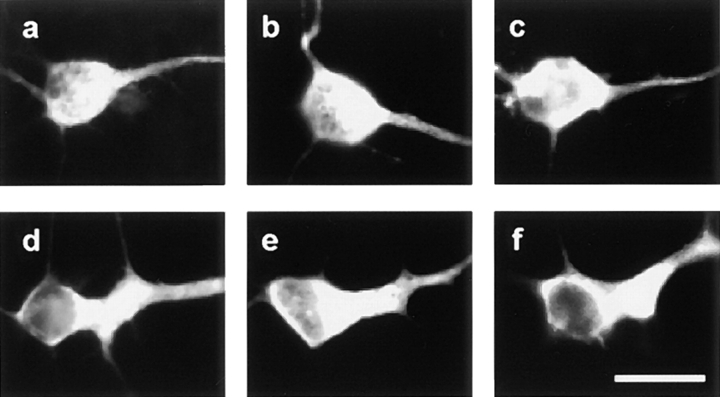
Neurofilaments are transported through axons by slow axonal transport. Abnormal accumulations of neurofilaments are seen in several neurodegenerative diseases, and this suggests that neurofilament transport is defective. Excitotoxic mechanisms involving glutamate are believed to be part of the pathogenic process in some neurodegenerative diseases, but there is currently little evidence to link glutamate with neurofilament transport. We have used a novel technique involving transfection of the green fluorescent protein-tagged neurofilament middle chain to measure neurofilament transport in cultured neurons. Treatment of the cells with glutamate induces a slowing of neurofilament transport. Phosphorylation of the side-arm domains of neurofilaments has been associated with a slowing of neurofilament transport, and we show that glutamate causes increased phosphorylation of these domains in cell bodies. We also show that glutamate activates members of the mitogen-activated protein kinase family, and that these kinases will phosphorylate neurofilament side-arm domains. These results provide a molecular framework to link glutamate excitotoxicity with neurofilament accumulation seen in some neurodegenerative diseases.


Figures

Figure 1
Figure 1
EGFP-NF-M assembly in transfected SW13− cells and 7-d-old primary rat cortical neurons. (a and b) SW13− cells cotransfected with EGFP-NF-M and NF-L; a shows NF-L and b shows EGFP-NF-M. (c and d) SW13− cells cotransfected with NF-L and NF-M; c shows NF-L and d shows NF-M. (e and f) SW13− cells transfected with NF-L, NF-M, NF-H, and EGFP-NF-M; e shows NF-L and f shows EGFP-NF-M. (g and h) Rat cortical neurons transfected with EGFP-NF-M; g shows NF-L and h shows EGFP-NF-M. Although only NF-L and EGFP-NF-M staining are shown in e and f, staining of similarly transfected cells with antibodies to either NF-L and NF-M, NF-L or NF-H, and EGFP-NF-M and NF-H revealed that >90% of cells express both plasmids. Thus, most cells appear to take up and express all three neurofilament subunits in these experiments. Bars, 25 μm.
Figure 2
Figure 2
Transport of EGFP-NF-M in transfected cortical neurons. Representative images of EGFP-NF-M–transfected cortical neurons at (a) 140, (b) 160, (c) 180, (d) 200, (e) 220, (f) 240, (g) 260, and (h) 280 min, and (i) 24 h after transfection are shown. (j) Also shown is an EGFP-transfected neuron 240 min after transfection. Bars, 100 μm.
Figure 3
Figure 3
Analyses of EGFP-NF-M transport in transfected neurons. Points shown are distances traveled by EGFP-NF-M at 140–280 min after transfection. For 2-deoxy-d-glucose/sodium azide treatment, cells were treated for the first 30 min. The data sets shown are from one representative experiment and error bars are SEM. One-way ANOVA tests showed significant differences between untreated and 2-deoxy-d-glucose/sodium azide–treated neurons at the 160-min time point (P = 0.026) and at all later time points (P < 0.001).
Figure 4
Figure 4
Glutamate inhibits EGFP-NF-M transport in transfected neurons. Points shown are distances traveled by EGFP-NF-M at 140–260 min after transfection. Cells were untreated or treated with 500, 50, or 30 μM glutamate. Glutamate was applied at the 140-min time point. The data sets shown are from one representative experiment and error bars are SEM. One-way ANOVA tests revealed no significant differences between untreated and glutamate-treated neurons at the 160-min time point (untreated versus 30 μM glutamate, P = 0.285; untreated versus 50 μM glutamate, P = 0.701; untreated versus 500 μM glutamate, P = 0.447). Significant differences between untreated and both 500 μM glutamate (P < 0.001) and 50 μM glutamate (P < 0.001), but not 30 μM glutamate (P = 0.132), treatments were detected at the 180-min time point. At later time points, significant differences were detected between untreated and all glutamate treatments (P < 0.001).
Figure 5
Figure 5
Effect of glutamate receptor antagonists on glutamate-induced inhibition of EGFP-NF-M transport. Histogram shows distance traveled by EGFP-NF-M 240 min after transfection in either untreated or 50-μM glutamate-treated neurons in the presence or absence of 1 μM MK-801, 5 μM CNQX, or 1 μM nifedipine. Glutamate was applied at the 140-min time point and inhibitors 10 min before this. Data from one representative experiment are shown. Asterisks indicate treatments that display significant differences (P < 0.001) compared with 50-μM glutamate treatment as analyzed by One-way ANOVA tests. No significant difference was observed between untreated neurons and neurons treated with glutamate in the presence of MK801. Error bars are SEM.
Figure 6
Figure 6
Glutamate activates p42 and p44 MAPKs and does not alter the levels of neurofilament or tubulin proteins in cortical neurons. 7-d-old cortical neurons were either untreated (un), or treated with 100 μM glutamate for 30, 60, or 120 min, and then analyzed by 12% SDS-PAGE and immunoblotting. No change in the total levels of either p42 or p44 MAPK (arrowheads), but a noticeable increase in the active forms of both these kinases was observed after glutamate treatment. Glutamate did not alter the levels of NF-L, NF-M, NF-H, or tubulin. An identically loaded Coomassie-stained gel is shown at the bottom to demonstrate equal protein loading of the samples.
Figure 7
Figure 7
Localization of active p42/p44MAPK, SAPKs, and phosphorylated NF-M/NF-H side-arms (SMI36 labeling) in untreated and glutamate-treated 7-d-old cortical neurons. a, c, and e are untreated cells; b, d, and f are treated with 100 μM glutamate for 30 min. Increased labeling for active p42/p44MAPK (a and b) and SAPKs (c and d) is seen after glutamate treatment. SMI36 labeling is markedly increased in cell bodies after glutamate exposure (e and f). Bar, 25 μm.
Figure 8
Figure 8
In vitro phosphorylation of NF-M side-arm and the MPR domain of NF-H side-arm with p42MAPK and SAPK1b. Left panels are phosphorylation by p42MAPK, and right panels are phosphorylation using SAPK1b. The top panels are the autoradiographs, and the bottom panels are the corresponding Coomassie-stained gels. RM are reaction mixes only without GST/NF-M/NF-H substrates; GST are reaction mixes with GST substrate; NF-M are reaction mixes with NF-M substrate; and NF-H are reaction mixes with the NF-H MPR domain substrate. Minus and plus signs refer to the absence or inclusion of kinases in the reaction mixes. The lower molecular mass species seen in tracks containing the NF-M side-arm domain are probably proteolytic degradation products since many of these react with NF-M antibodies. We were unable to inhibit this proteolysis despite using cocktails of protease inhibitors.
Figure 9
Figure 9
Glutamate induces increased phosphorylation of NF-M/NF-H side-arms in cell bodies of EGFP-NF-M–transfected neurons. Cells were transfected with EGFP-NF-M and, 320 min after transfection, were fixed and immunostained with SMI36. a and b are untreated; c and d are treated with 100 μM glutamate for 180 min. a and c show EGFP-NF-M; b and d show SMI36 labeling. Note the proximal accumulation of neurofilament protein in the glutamate-treated cell. Bar, 25 μm.
Figure 10
Figure 10
EGFP-NF-M accumulations begin to develop in proximal neurites of some transfected neurons treated with 100 μM glutamate for 180 min (i.e., 320 min after transfection). Images shown are of EGFP-NF-M in proximal regions of neurites 320 min after transfection in untreated cells (a–c) and cells treated with 100 μM glutamate for 180 min and in which neurofilament accumulations are starting to develop (d–f). Bar, 25 μm.

Similar articles

Cited by

References

    1. Aplin A.E., Gibb G.M., Jacobsen J.S., Gallo J.-M., Anderton B.H. In vitro phosphorylation of the cytoplasmic domain of the amyloid precursor protein by glycogen synthase kinase-3β. J. Neurochem. 1996;67:699–707. - PubMed
    1. Archer D.R., Watson D.F., Griffin J.W. Phosphorylation-dependent immunoreactivity of neurofilaments and the rate of slow axonal transport in the central and peripheral axons of the rat dorsal root ganglia. J. Neurochem. 1994;62:1119–1125. - PubMed
    1. Asahara H., Taniwaki T., Ohyagi Y., Yamada T., Kira J. Glutamate enhances phosphorylation of neurofilaments in cerebellar granule cell culture. J. Neurol. Sci. 1999;171:84–87. - PubMed
    1. Baas P.W., Brown A. Slow axonal transportthe polymer transport model. Trends Cell Biol. 1997;7:380–384. - PubMed
    1. Bading H., Greenberg M.E. Stimulation of protein tyrosine phosphorylation by NMDA receptor activation. Science. 1991;253:912–914. - PubMed

Publication types

MeSH terms