. 2000 Jul 10;150(1):213-24.
doi: 10.1083/jcb.150.1.213.

Intracellular pH regulation by Na(+)/H(+) exchange requires phosphatidylinositol 4,5-bisphosphate

Affiliations

Intracellular pH regulation by Na(+)/H(+) exchange requires phosphatidylinositol 4,5-bisphosphate

O Aharonovitz et al. J Cell Biol. .

Abstract

The carrier-mediated, electroneutral exchange of Na(+) for H(+) across the plasma membrane does not directly consume metabolic energy. Nevertheless, acute depletion of cellular ATP markedly decreases transport. We analyzed the possible involvement of polyphosphoinositides in the metabolic regulation of NHE1, the ubiquitous isoform of the Na(+)/H(+) exchanger. Depletion of ATP was accompanied by a marked reduction of plasmalemmal phosphatidylinositol 4,5-bisphosphate (PIP(2)) content. Moreover, sequestration or hydrolysis of plasmalemmal PIP(2), in the absence of ATP depletion, was associated with profound inhibition of NHE1 activity. Examination of the primary structure of the COOH-terminal domain of NHE1 revealed two potential PIP(2)-binding motifs. Fusion proteins encoding these motifs bound PIP(2) in vitro. When transfected into antiport-deficient cells, mutant forms of NHE1 lacking the putative PIP(2)-binding domains had greatly reduced transport capability, implying that association with PIP(2) is required for optimal activity. These findings suggest that NHE1 activity is modulated by phosphoinositides and that the inhibitory effect of ATP depletion may be attributable, at least in part, to the accompanying net dephosphorylation of PIP(2).


Figures

Figure 1
Figure 1
Effect of intracellular ATP depletion on NHE activity and on total PIP2 content. AP-1/NHE1′HA cells were either untreated (Control) or metabolically depleted by incubation with 5 mM 2-deoxy-d-glucose and 5 μg/ml antimycin A for 10 min at 37°C. (A) Intracellular ATP content determined using luciferin–luciferase. Results were normalized to the control and are the mean ± SE of four determinations. (B) Measurement of intracellular pH (pHi) using BCECF. The cells were acid-loaded by prepulsing with NH4 + and recording was started upon addition of Na+ to the bathing medium. Representative of four similar pHi determinations. (C) Measurement of cytosolic Ca2+ using Fura-2. Where indicated by the arrow, purinergic receptors were activated by addition of 1 mM extracellular ATP. Representative of four similar determinations. (D) Determination of PIP2 content. Lipids were extracted from control or ATP-depleted cells, and the PIP2 content was measured by TLC of 32P-labeled PIP2 (two leftmost bars) or by immunological detection of PIP2 on dot-blots (two rightmost bars) as described in Materials and Methods. The insets show representative experiments, while the main panel summarizes the results of three chromatography and four dot-blot assays, normalized to the control (mean ± SEM).
Figure 2
Figure 2
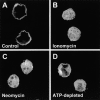
Assessment of plasmalemmal PIP2 content using PHPLCδ-GFP. AP-1/NHE1′HA cells were transiently transfected with PHPLCδ-GFP and analyzed by confocal microscopy. The height of the cells was estimated, and optical sections, obtained through the middle of the cells, were acquired. (A) Untreated cells. (B) Cells incubated with 10 μM ionomycin for 5 min. (C) Cells preincubated overnight with 5 mM neomycin. (D) Cells that were ATP depleted as in Fig. 1. Images shown in A–D are representative of four independent experiments. (E) Ratio of the fluorescence intensity determined at the outermost edge of the image (plasma membrane or outermost layer of the cytosol) divided by the fluorescence of an equivalent area measured near the center of the cell (cytosol). Data are means ± SEM of at least 20 determinations of each kind, from four similar experiments. Where absent, error bars are smaller than the lines limiting the bars.
Figure 2
Figure 2
Assessment of plasmalemmal PIP2 content using PHPLCδ-GFP. AP-1/NHE1′HA cells were transiently transfected with PHPLCδ-GFP and analyzed by confocal microscopy. The height of the cells was estimated, and optical sections, obtained through the middle of the cells, were acquired. (A) Untreated cells. (B) Cells incubated with 10 μM ionomycin for 5 min. (C) Cells preincubated overnight with 5 mM neomycin. (D) Cells that were ATP depleted as in Fig. 1. Images shown in A–D are representative of four independent experiments. (E) Ratio of the fluorescence intensity determined at the outermost edge of the image (plasma membrane or outermost layer of the cytosol) divided by the fluorescence of an equivalent area measured near the center of the cell (cytosol). Data are means ± SEM of at least 20 determinations of each kind, from four similar experiments. Where absent, error bars are smaller than the lines limiting the bars.
Figure 4
Figure 4
Effects of ATP depletion and of ionomycin on the exchange activity of NHE1Δ582. AP-1 cells stably transfected with NHE1Δ582 were either untreated (Control), ATP depleted as in Fig. 1, or incubated with either 2 or 10 μM ionomycin for 5 min. Acid loading and fluorimetric determination of pHi were as in Fig. 3. Note that ATP depletion and treatment with ionomycin were performed during the final stages of BCECF loading. (A) Representative pHi determinations. (B) Rates of recovery measured at pHi 6.4 are summarized as means ± SEM of at least four determinations.
Figure 6
Figure 6
Binding of PIP2 to NHE1-derived fusion proteins. (Top) Primary sequence of the juxtamembrane region of NHE1 (residues 506–576) that contains two potential PIP2-binding domains. The wild-type (WT) sequence is shown at the top, highlighting the cationic residues within the putative PIP2-binding sites 1 and 2. The synthetic peptide, which is used for competition experiments (residues 550–564), is bracketed. In mutant 1 (M1), the cationic residues in site 1 were mutated to alanine (second line). In mutant 2 (M2), the cationic residues in site 2 were mutated to alanine (third line). In the double mutant (M1 + 2), both sets of cationic residues were mutated (bottom line). (bottom left) Graph showing results of PIP2 binding determinations to either GST alone (leftmost bar) or GST fusions encompassing the indicated regions of NHE1. Where specified, sites 1 and/or 2 were mutated as above. Where indicated, peptide 550–564 was added to compete for PIP2 binding. Results are normalized to the binding to GST, and are means ± SEM of eight determinations. (bottom right) Schematic representation of the predicted topology of NHE1, indicating the location of the putative PIP2-binding sites 1 and 2.
Figure 3
Figure 3
Effect of neomycin on F-actin distribution and on NHE1 activity. AP-1/NHE1′HA cells were incubated overnight without or with neomycin (5 mM). (A and B) Cells were stained with rhodamine-phalloidin to visualize F-actin. Representative micrographs of untreated (A) or neomycin-treated (B) cells. (C) Measurement of NHE activity. Control and neomycin-pretreated cells were loaded with BCECF, acidified by prepulsing with NH4 +, and the Na+-induced alkalinization was measured fluorimetrically. Representative of four similar pHi determinations.
Figure 3
Figure 3
Effect of neomycin on F-actin distribution and on NHE1 activity. AP-1/NHE1′HA cells were incubated overnight without or with neomycin (5 mM). (A and B) Cells were stained with rhodamine-phalloidin to visualize F-actin. Representative micrographs of untreated (A) or neomycin-treated (B) cells. (C) Measurement of NHE activity. Control and neomycin-pretreated cells were loaded with BCECF, acidified by prepulsing with NH4 +, and the Na+-induced alkalinization was measured fluorimetrically. Representative of four similar pHi determinations.
Figure 5
Figure 5
Effects of PHPLCδ-GFP and PM-5′-phosphatase-GFP on NHE activity. COS-1 cells were transiently transfected with either PHPLCδ-GFP or PM-5′-phosphatase-GFP. After 24 h, transfected cells were identified by visualizing GFP fluorescence. A neutral density filter was interposed in the light path, and the cells were stained with BCECF while on the microscope stage. Acid loading and fluorimetric determination of pHi were as in Fig. 3. (A) Fluorimetric pHi determinations in control (open circles) and PHPLCδ-GFP–transfected cells (solid circles). Na+ was added after 45 s. Values are means ± SEM of at least five determinations. (B) Rates of pHi recovery measured during the first minute after the addition of Na+ in experiments like that in A are summarized as means ± SEM for control (n = 21), PHPLCδ-GFP (n = 5), or PM-5′-phosphatase-GFP (n = 3)–transfected cells.
Figure 7
Figure 7
Comparative analysis of Na+-induced pHi recovery of AP-1 cells transfected with wild-type and mutant forms of NHE1 under control and ATP-depleted conditions. (A) Analysis of surface expression of NHE1′HA by immunoblotting. AP-1 cells were stably transfected with wild-type or mutant (M1, M2, and M1 + 2) NHE1′HA. The cells were treated with or without chymotrypsin (100 U/ml, 5 min) and whole cell extracts were analyzed by electrophoresis and immunoblotting with anti-HA antibody. Note that the amounts of protein loaded are not identical: NHE1 = 4 μg; NHE1-M1 = 4 μg; NHE1-M2 = 10 μg; and NHE1-M1 + 2 = 7 μg. The position of the fully glycosylated (∼105 kD, Mature) and incompletely glycosylated (∼80 kD, Immature) forms of full-length NHE1, and of the main proteolytic fragment (∼75 kD) are shown. The blot is representative of three similar experiments. (B) Comparison of the Na+/H+ exchange activity determined from the rate of H+ extrusion as in Fig. 3 in AP-1 cells transfected with wild-type or mutant forms of NHE1′HA. The rates of Na+-induced alkalinization were recorded, normalized for plasmalemmal NHE1 expression, and displayed as a function of the pHi. Data are means ± SEM of at least five determinations. Where absent, error bars are smaller than the symbol. (C) AP-1 cells transfected with wild-type or mutant forms of NHE1′HA were either untreated or subjected to ATP depletion, as in Fig. 1. The rates of Na+-induced alkalinization measured at pHi 6.4 are illustrated. Data are means ± SEM of at least four determinations.
Figure 8
Figure 8
Comparative analysis of rates of 22Na+ influx of AP-1 cells transfected with wild-type and mutant forms of NHE1 under control and ATP-depleted conditions. AP-1 cells transfected with wild-type (WT) or mutant forms (M1, M2, and M1 + 2) of NHE1′HA were either untreated (Con) or subjected to ATP depletion (−ATP). (A–D) The cells were clamped at the indicated pHi, and the rates of 22Na+ uptake were measured, as detailed in Material and Methods. (A) WT; (B) M1; (C) M2; and (D) M1 + 2. To facilitate comparison of the effects of mutating the PIP2-binding sites, the rates of 22Na+ influx of wild-type and the mutant forms of NHE1 were normalized to their respective plasmalemmal protein levels, and then expressed relative to the maximal uptake rate of wild-type NHE1. In B–D, the dashed line indicates the wild-type NHE1 profile in control cells. Data are means ± SEM of three separate experiments, each performed in quadruplicate. Where absent, error bars are smaller than the symbol.

Similar articles

Cited by

References

    1. Aharonovitz O., Grinstein S. Na+/H+ exchangersstructure, function and regulation. Drugs News Perspect. 1999;12:105–109.
    1. Aharonovitz O., Demaurex N., Woodside M., Grinstein S. ATP dependence is not an intrinsic property of Na+/H+ exchanger NHE1requirement for an ancillary factor. Am. J. Physiol. 1999;276:C1303–C1311. - PubMed
    1. Baukrowitz T., Schulte U., Oliver D., Herlitze S., Krauter T., Tucker S.J., Ruppersberg J.P., Fakler B. PIP2 and PIP as determinants for ATP inhibition of KATP channels. Science. 1998;282:1141–1144. - PubMed
    1. Bertrand B., Wakabayashi S., Ikeda T., Pouyssegur J., Shigekawa M. The Na+/H+ exchanger isoform 1 (NHE1) is a novel member of the calmodulin-binding proteins. Identification and characterization of calmodulin-binding sites. J. Biol. Chem. 1994;269:13703–13709. - PubMed
    1. Brown S.E., Heming T.A., Benedict C.R., Bidani A. ATP-sensitive Na+-H+ antiport in type II alveolar epithelial cells. Am. J. Physiol. 1991;261:C954–C963. - PubMed

Publication types

MeSH terms