. 2000 Jul 15;526 Pt 2(Pt 2):327-39.
doi: 10.1111/j.1469-7793.2000.t01-1-00327.x.

All classes of calcium channel couple with equal efficiency to exocytosis in rat melanotropes, inducing linear stimulus-secretion coupling

Affiliations

All classes of calcium channel couple with equal efficiency to exocytosis in rat melanotropes, inducing linear stimulus-secretion coupling

H D Mansvelder et al. J Physiol. .

Abstract

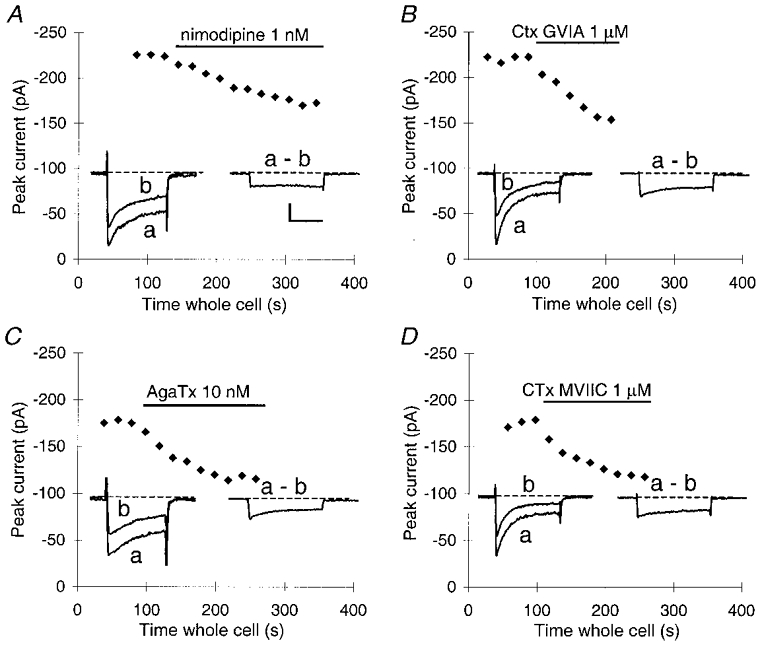
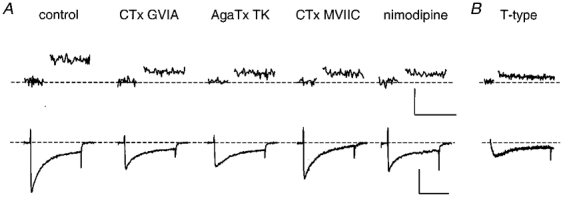
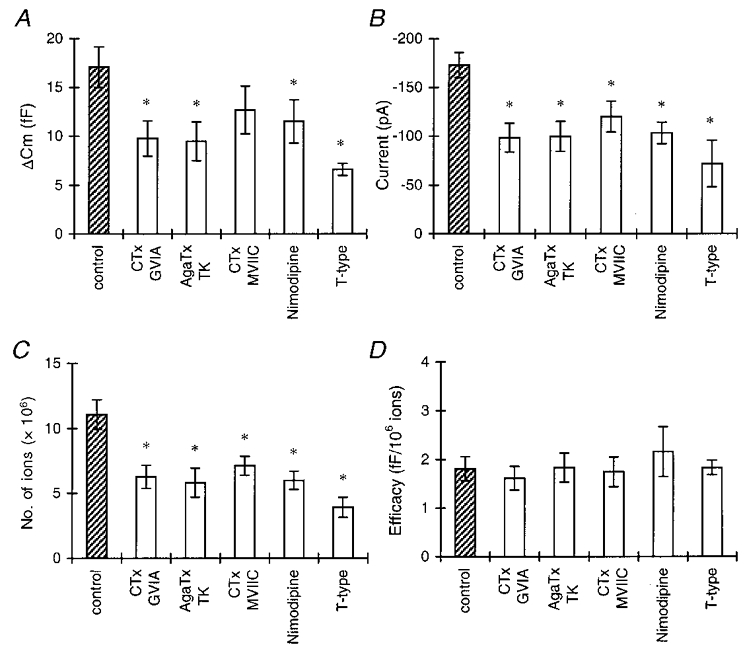
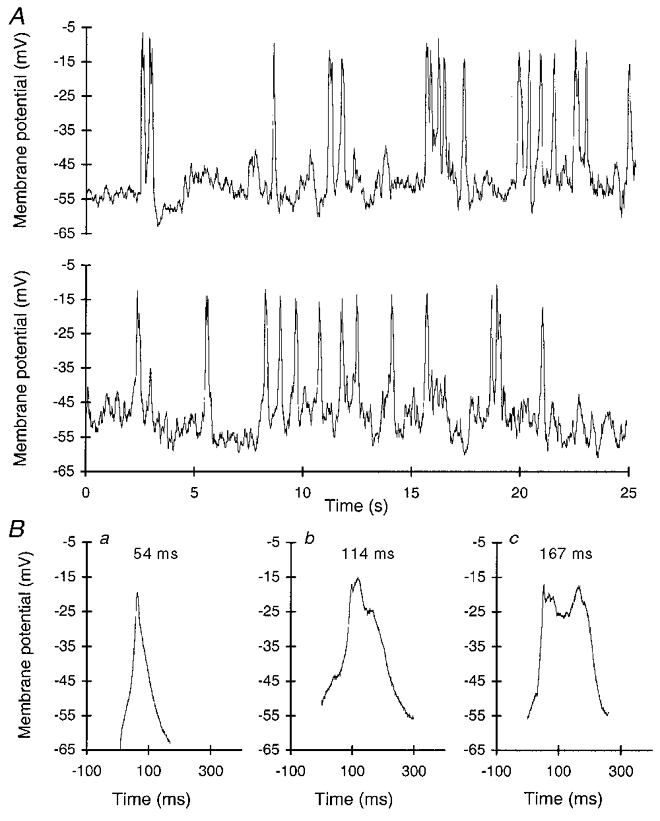
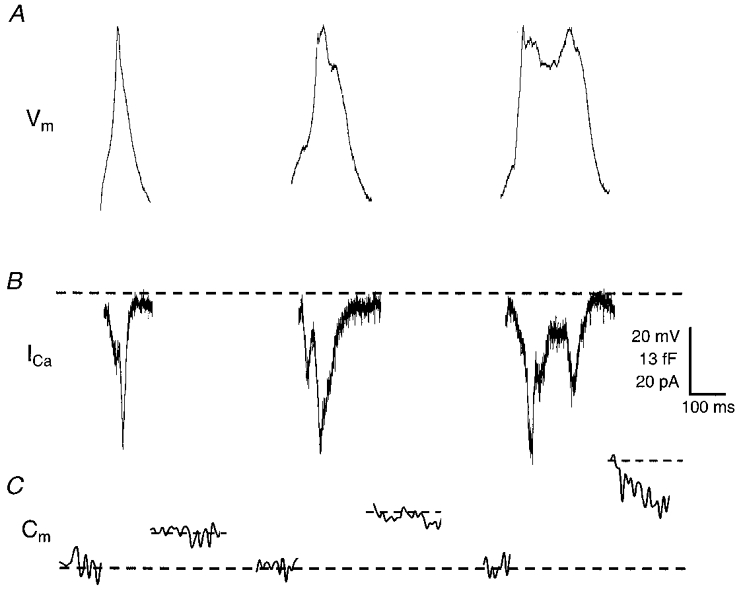
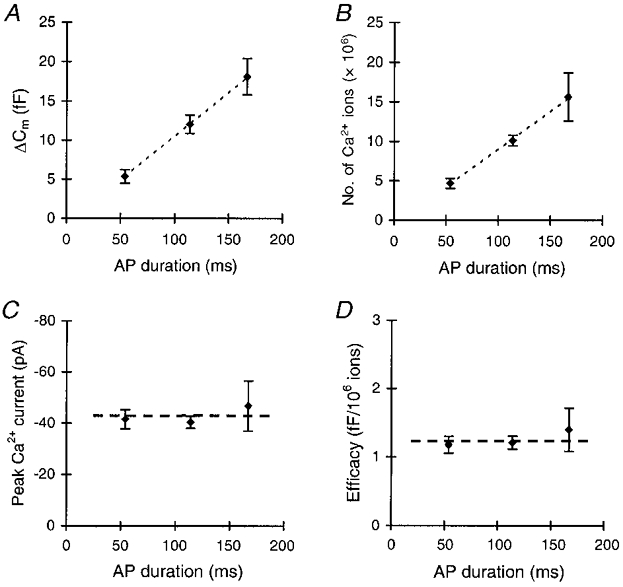
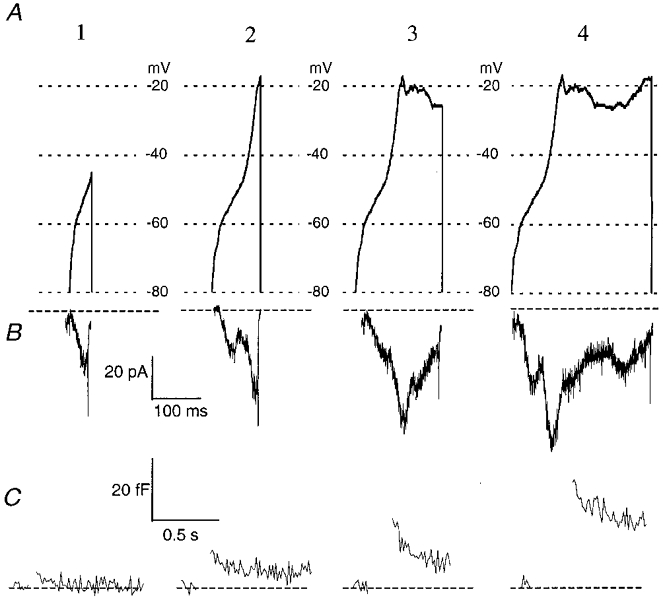
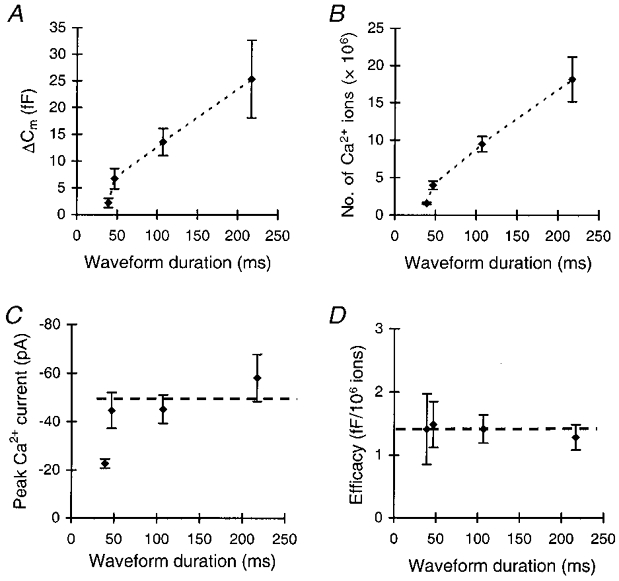
1. The contribution of low voltage-activated (LVA) T-type Ca2+ channels and four different types of high voltage-activated (HVA) Ca2+ channel to exocytosis, and the relationship between calcium influx and exocytosis during action potentials (APs) were studied in pituitary melanotropes. 2. Selective HVA Ca2+ channel blockers reduced exocytosis, monitored by membrane capacitance measurements, proportional to the reduction in Ca2+ influx. The efficacy of Ca2+ in stimulating exocytosis did not change in the presence of the Ca2+ channel blockers, indicating that all HVA Ca2+ channels act together in stimulating exocytosis. 3. The relationship between Ca2+ influx and exocytosis during the AP was examined using APs recorded from spontaneously active melanotropes as command templates under voltage clamp. Under voltage clamp, multiphasic Ca2+ currents were activated over the entire duration of the APs, i.e. during the rising phase as well as the plateau phase. The maximum amplitude of the Ca2+ current coincided with the peak of the AP. 4. The relationship between Ca2+ entry and exocytosis was linear for the different phases of the AP. Also, the influx of Ca2+ through LVA T-type channels stimulated exocytosis with the same efficacy as through the HVA channels. 5. APs of increasing duration ( approximately 50 to approximately 300 ms) evoked increasing amounts of exocytosis. The number of entering Ca2+ ions and the capacitance change were linearly related to AP duration, resulting in a fixed relationship between Ca2+ entry and exocytosis. 6. The results show that Ca2+ ions, entering a melanotrope, couple with equal strength to exocytosis regardless of the channel type involved. We suggest that the linear relationship between Ca2+ entry and secretion observed under physiological conditions (during APs), results from the equal strength with which LVA and HVA channels in melanotropes couple to exocytosis. This guarantees that secretion takes place over the entire duration of the AP.


Figures

Figure 1
Figure 1. Kinetics of block of the whole-cell HVA Ca2+ current by different blockers
Block was induced by 1 nM nimodipine (A), 1 μmω-CgTx GVIA (B), 10 nM ω-AgTx TK (C) and 1 μmω-CgTx MVIIC (D). Every data point represents the peak inward current reached during a 40 ms depolarization from -80 mV to +10 mV (holding potential, -80 mV). To allow Ca2+ channels to recover from inactivation, the interval between depolarizations was 20 s. All drugs were applied after three or four stable control pulses. Bars indicate the timing of drug applications. Left insets, example traces in the absence (a) and presence (b) of the Ca2+ channel blocker. Right insets, means of the current blocked by the Ca2+ channel blocker.
Figure 2
Figure 2. All classes of Ca2+ channel contribute to release, as indicated by selective activation of T-type channels or application of selective blockers of HVA channels
A, upper traces, changes in Cm in response to a step depolarization of 40 ms. The control Cm response and the responses in the presence of the Ca2+ channel blockers were evoked by depolarizations from -80 mV to +10 mV. Lower traces, Ca2+ currents evoked by the step depolarizations. In the presence of blockers, the Ca2+ currents were reduced. Single example traces are shown. B, upper trace, the Cm change in response to only T-type current activation evoked by a 40 ms step depolarization from -80 mV to -40 mV. Lower trace, example of the T-type current response at -40 mV. Application of either control solution or solutions containing one of the blockers was started 3 min before the step depolarizations were applied. Each point in the Cm traces is a consecutive mean of 10 Cm samples with a 1 ms time resolution. Thus, the resulting time resolution of the Cm traces shown here is 10 ms per sample. Each cell was subjected to only one set of five step depolarizations (1 Hz), because a second train of depolarizations always evoked less exocytosis than the first train. The traces shown here are the means of three single traces obtained from one cell per group. Cm measurements were interrupted during the depolarizations.
Figure 3
Figure 3. All classes of calcium channel couple with equal efficency to exocytosis
A, the amount of exocytosis per step depolarization for control conditions (total HVA current), selective activation of the T-type current, and the HVA current in the presence of selective HVA Ca2+ channel blockers. First, the mean ΔCm elicited by five step depolarizations was calculated per cell, then the mean for the total group was calculated. Asterisks in A-C indicate statistical differences from the control group ( P < 0.05). B, peak amplitudes of the control Ca2+ current, the T-type current, and the HVA current in the presence of different Ca2+ channel blockers. C, number of Ca2+ ions entering the cell during a step depolarization, calculated as described in Methods. D, efficacy of Ca2+ ions in stimulating exocytosis. ΔCm was divided by the number of Ca2+ ions entering the cell for each depolarizing pulse. For each cell, the mean efficacy for five pulses was calculated. Shown are the means of a number of cells (see text) per group. There was no significant difference between the control group and the groups with the Ca2+ channel blockers. (Stimulation protocols are as described for Fig. 2.)
Figure 4
Figure 4. AP recordings from melanotropes firing spontaneously
A, example of the spontaneous activity of a melanotrope (consecutive traces). B, APs that were selected to be used as templates for stimulation in voltage-clamp experiments. Durations at half-maximal amplitude are given above the traces.
Figure 5
Figure 5. Exocytosis increases with increasing AP duration
A, AP templates used with the PULSE software. For technical reasons, AP waveforms had to start from a holding potential of -80 mV (see text for explanation). B, example traces of the calcium currents elicited by the APs depicted in A. The peak currents coincided with the peak membrane voltages reached during the AP. C, examples of the membrane capacitance traces associated with the various AP templates. Cm measurements were interrupted during stimulation with the AP templates. Cm traces shown are the means of three such traces obtained from single cells. Note the different time scales in B and C.
Figure 6
Figure 6. The efficacy of Ca2+ ions in stimulating exocytosis is the same for different APs
A, the mean increase in Cm per AP increases with increasing AP duration. Each cell was subjected once to stimulation with five successive APs at 1 Hz. The mean Cm response to these stimulations was calculated for each cell, and these means were averaged for a number of different cells. For each AP waveform different cells were taken. B, the number of Ca2+ ions that entered the cell during the AP increased with increasing AP duration. Dashed lines in A and B are linear regression lines. C, the peak Ca2+ currents during the APs were the same for the different AP waveforms. D, the efficacy of Ca2+ ions in stimulating exocytosis, expressed as the ratio of capacitance change per 106 Ca2+ ions, was constant for the different AP waveforms (n= 8–12). The duration of the idealized APs, as expressed on the horizontal axis in A-D, was measured at the half-maximal amplitude.
Figure 7
Figure 7. Different phases of the AP contribute equally to exocytosis
A, stimulus templates of the different parts of the AP. Template 1 is the first half of the rising phase up to a voltage of -45 mV. Template 2 comprises the complete rising phase. The last template (4) is the complete double AP without the repolarizing phase. All templates ended with an immediate step back to the rest holding potential of -80 mV. B, examples of the Ca2+ currents evoked by the templates shown in A. As in Fig. 2, different peaks can be distinguished in the traces. Trace 1 shows the current carried by LVA T-type channels, since the maximal voltage during stimulation was -45 mV. In the other traces, HVA components were also present. C, changes in Cm evoked by the Ca2+ currents in B. With increasing pulse duration, ΔCm also increased.
Figure 8
Figure 8. The efficacy in stimulating exocytosis is the same for different phases of the AP
A, mean capacitance change evoked by different phases of the AP, plotted as ΔCm against waveform duration, measured at the half-maximal amplitude. Each cell was subjected to one train of five stimuli. B, the number of Ca2+ ions entering the cell during a stimulus for the different stimulus templates. Note the very similar patterns of increase in the number of entering ions and in the ΔCm in B and A. C, maximal amplitude of the Ca2+ currents during the stimulations. Asterisks denote a significant difference from the peak current in the other groups at P < 0.05. D, the efficacy of Ca2+ ions in stimulating exocytosis for the different stimulus templates, expressed as the capacitance change per 106 Ca2+ ions (n= 7 for each template).

Similar articles

Cited by

References

    1. Ämmälä C, Ashcroft FM, Rorsman P. Calcium-independent potentiation of insulin release by cyclic AMP in single β cells. Nature. 1993;363:356–358. - PubMed
    1. Artalejo CR, Adams ME, Fox AP. Three types of Ca2+ channel trigger secretion with different efficacies in chromaffin cells. Nature. 1994;367:72–76. - PubMed
    1. Artalejo CR, Mogul DJ, Perlman RL, Fox AP. Bovine chromaffin cells exhibit three types of calcium channels: facilitation, induced by large pre-depolarizations or repetitive activity is due to the increased opening probability of a 27 pS channel. The Journal of Physiology. 1991;444:213–240. - PMC - PubMed
    1. Augustine GJ. Regulation of transmitter release at the squid giant synapse by presynaptic delayed rectifier potassium current. The Journal of Physiology. 1990;431:343–364. - PMC - PubMed
    1. Augustine GJ, Charlton MP. Calcium dependence of presynaptic calcium current and post-synaptic response at the squid giant synapse. The Journal of Physiology. 1986;381:619–640. - PMC - PubMed

Publication types

MeSH terms

LinkOut - more resources