. 2000 Jul;10(7):1031-42.
doi: 10.1101/gr.10.7.1031.

A system for specific, high-throughput genotyping by allele-specific primer extension on microarrays

Affiliations

A system for specific, high-throughput genotyping by allele-specific primer extension on microarrays

T Pastinen et al. Genome Res. 2000 Jul.

Abstract

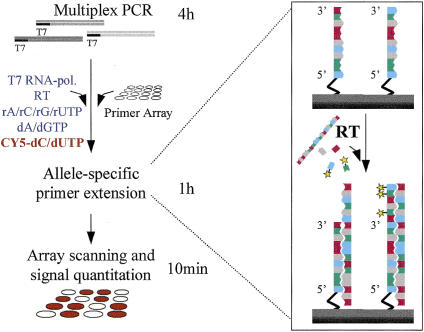
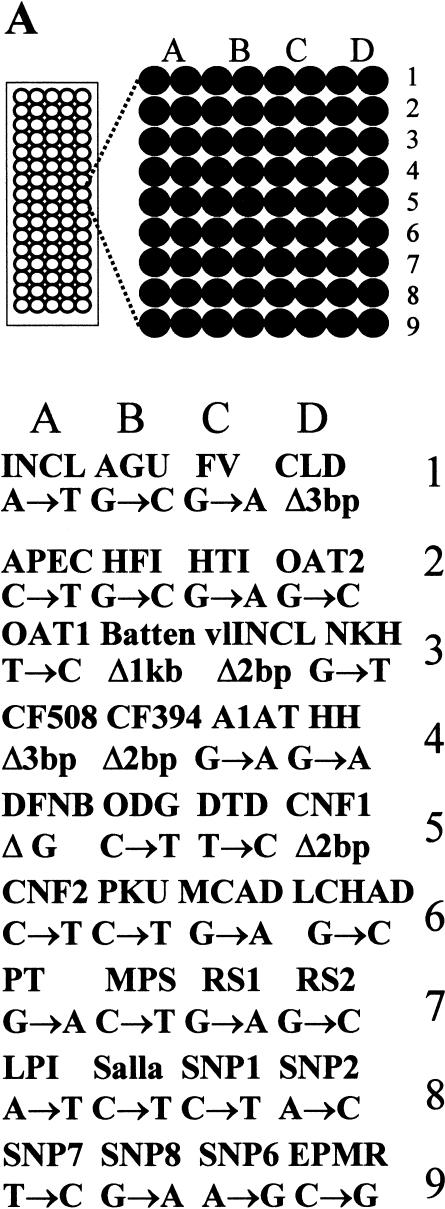
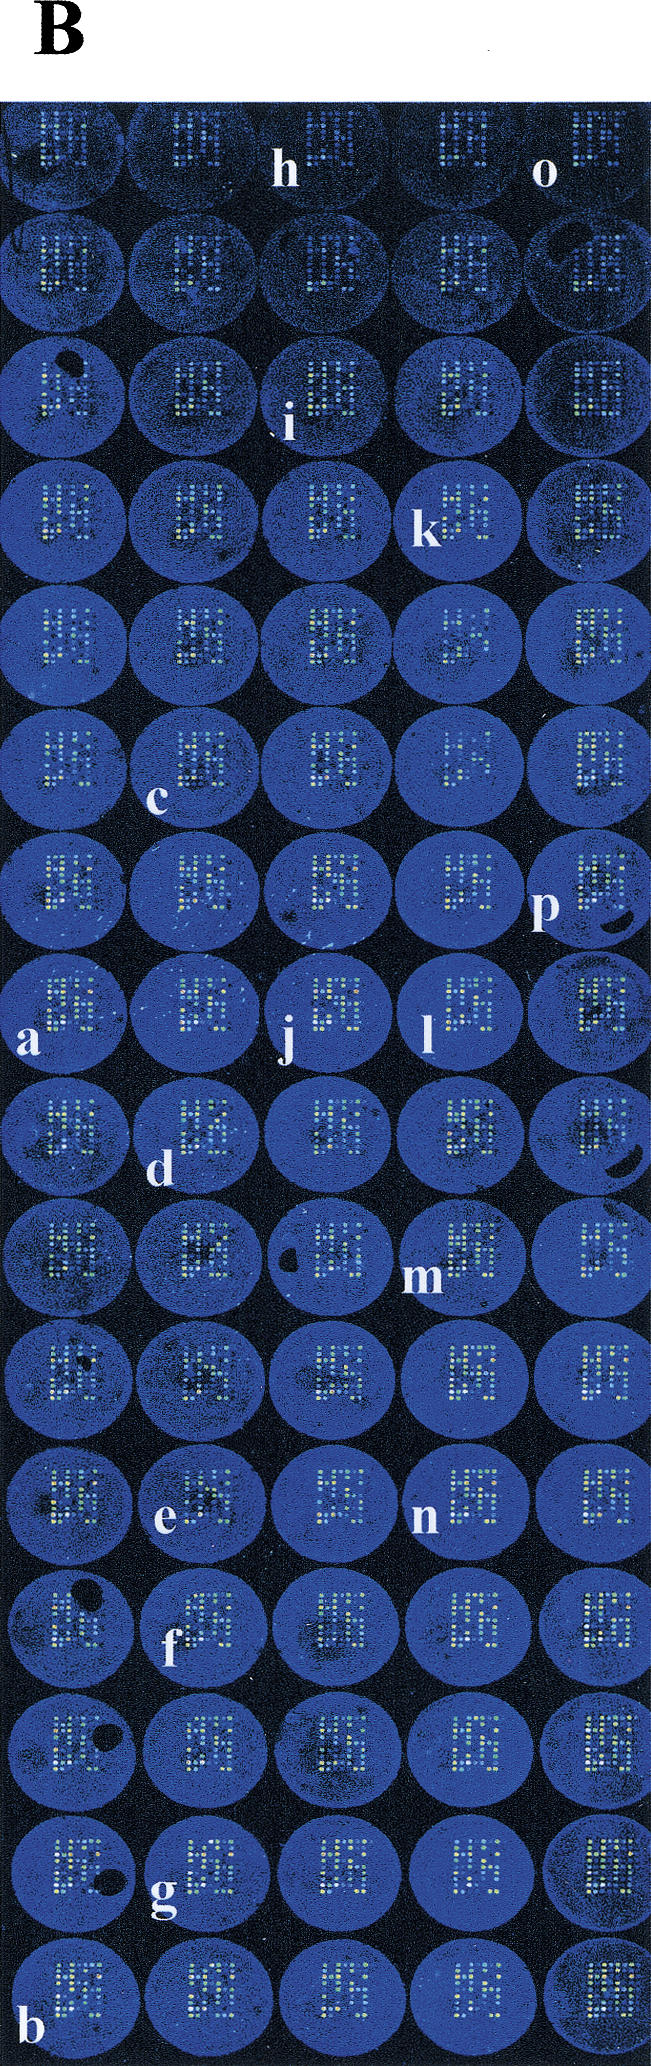
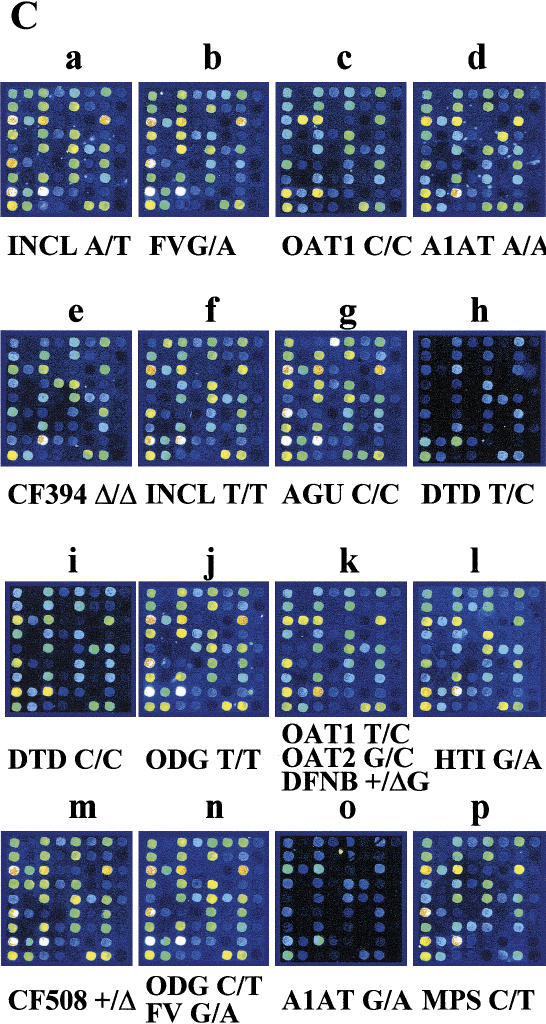
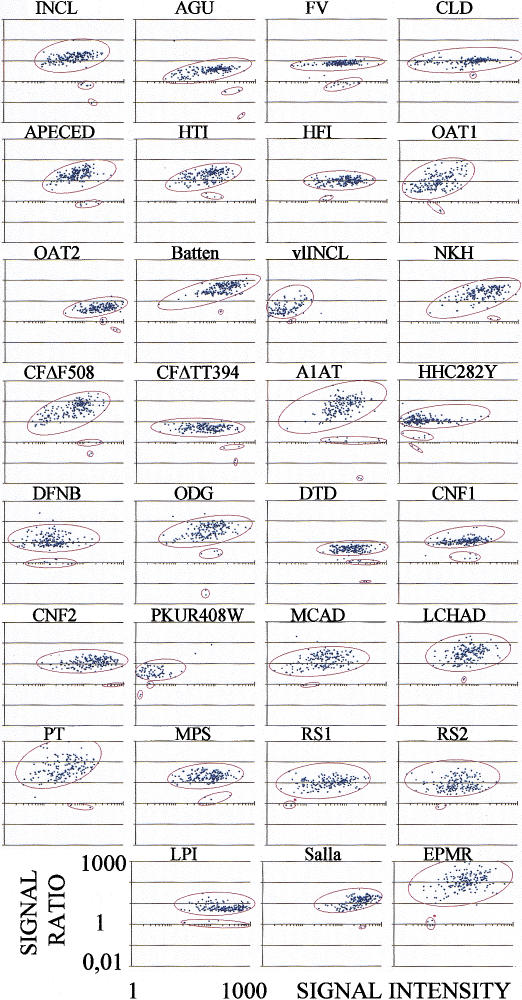
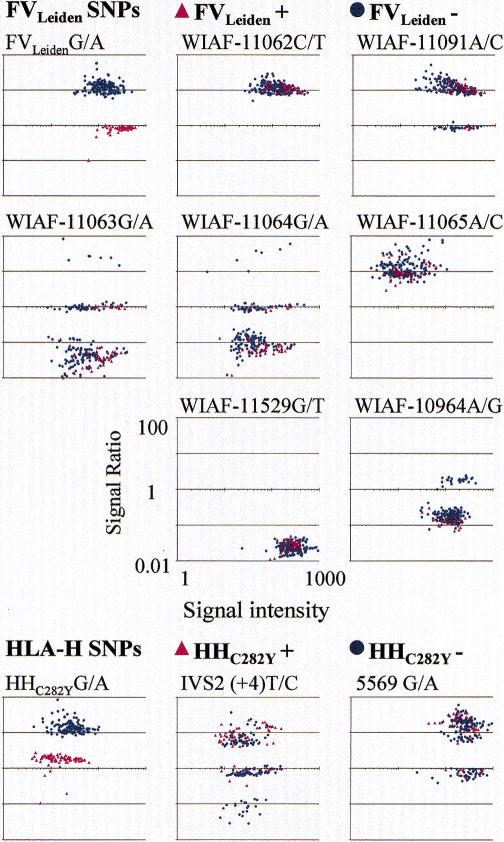
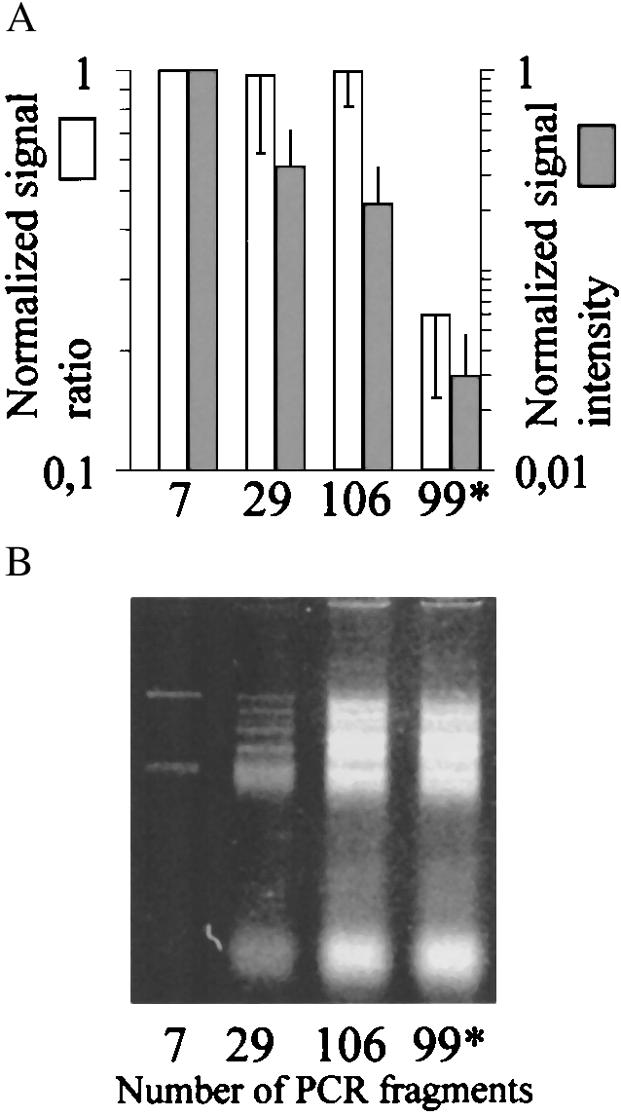
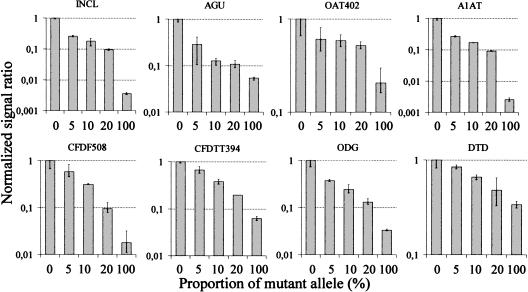
This study describes a practical system that allows high-throughput genotyping of single nucleotide polymorphisms (SNPs) and detection of mutations by allele-specific extension on primer arrays. The method relies on the sequence-specific extension of two immobilized allele-specific primers that differ at their 3'-nucleotide defining the alleles, by a reverse transcriptase (RT) enzyme at optimized reaction conditions. We show the potential of this simple one-step procedure performed on spotted primer arrays of low redundancy by generating over 8000 genotypes for 40 mutations or SNPs. The genotypes formed three easily identifiable clusters and all known genotypes were assigned correctly. Higher degrees of multiplexing will be possible with this system as the power of discrimination between genotypes remained unaltered in the presence of over 100 amplicons in a single reaction. The enzyme-assisted reaction provides highly specific allele distinction, evidenced by its ability to detect minority sequence variants present in 5% of a sample at multiple sites. The assay format based on miniaturized reaction chambers at standard 384-well spacing on microscope slides carrying arrays with two primers per SNP for 80 samples results in low consumption of reagents and makes parallel analysis of a large number of samples convenient. In the assay one or two fluorescent nucleotide analogs are used as labels, and thus the genotyping results can be interpreted with presently available array scanners and software. The general accessibility, simple set-up, and the robust procedure of the array-based genotyping system described here will offer an easy way to increase the throughput of SNP typing in any molecular biology laboratory.


Figures

Figure 1
Figure 1
Steps and principle of allele-specific extension on primer arrays. Multiplex PCRs yielding amplicons tailed with 5′-T7 RNA polymerase promoter sequence are performed. The PCR products are added directly to the primer array, along with the reaction mixture, which contains both T7 RNA polymerase and rNTPs to generate RNA targets from the PCR products and RT and labeled dNTPs for the actual allele-specific genotyping reaction, which is illustrated in the inset on the right column. For genotyping a pair of allele-specific detection primers for each mutant or polymorphic site immobilized through their 5′ end are used. The two primers differ at their 3′ end, which is complementary to either of the variant alleles. The RT extends the immobilized detection primers with labeled dNTPs in a template-dependent manner. After the reaction, fluorescence scanning of the arrays and quantitation of the fluorescent signals are carried out using a commercial confocal scanner and software. The fluorescent signals from each primer pair are compared, and the signal ratios fall into distinct categories defining the genotype at each site. The timescale for the reaction steps is illustrated beside the left column of the figure.
Figure 2
Figure 2
Strategy and result from high-throughput genotyping on allele-specific primer extension arrays. (A) The design of an array is illustrated schematically. Eighty separate reaction chambers have been formed on each microscope glass slide, using a 384-well formatted silicon rubber grid. Each of these reaction chambers contain an identical array of 72 primers for detection of 36 mutations or SNPs. The vertical columns (A–D) contain pairs of allele-specific primers for each site ordered into nine horizontal rows (1–9). The acronyms corresponding to the diseases and the mutant or variant nucleotides analyzed on the array are given in the lower part of A. INCL = infantile neuronal ceroid lipofuscinosis (Vesa et al. 1995); AGU = aspartylglucosaminuria (Ikonen et al. 1991); FV = Factor V Leiden (Bertina et al. 1994); CCD = congenital chloride diarrhea (Höglund et al. 1996); APECED = autoimmune polyendocrinopathy-candidiasis-ectodermal dystrophy (the Finnish-German APECED Consortium 1997); HTI = hereditary tyrosinemia type I (St-Louis et al. 1994); HFI = hereditary fructose intolerance (Cross et al. 1990); OAT1 & 2 = gyrate atrophy of the choroid and retina (Mitchell et al.1989); Batten = Batten disease (the International Batten Disease Consortium 1995); vLINCL = variant late infantile neuronal ceroid lipofuscinosis (Savukoski et al. 1998); NKH = nonketotic hyperglycinemia (Kure et al. 1992); CF Δ508/ΔTT394 = cystic fibrosis (Kere et al. 1994); A1AT = α1-antitrypsin deficiency Z-mutation (Cox et al. 1988); HH = hereditary hemochromatosis C282Y (Feder et al. 1996); DFNB=nonsyndromic deafness, connexin 26 35insG (Denoyelle et al. 1997); ODG = hypergonadotropic ovarian dysgenesis (Aittomaki et al. 1995); DTD = diastrophic dysplasia (Hästbacka et al. submitted); CNFmaj/min = congenital nephrosis (Kestilä et al. 1998); PKU R408W = phenylketonuria (Guldberg et al. 1995); MCAD = medium-chain acyl-CoA dehydrogenase deficiency (Matsubara et al. 1990); LCHAD = long-chain 3-hydroxyacyl-CoA dehydrogenase deficiency (Ijist et al. 1996); PT = prothrombin G20210A (Poort et al. 1996); MPS = mucopolysaccharidosis type I (Bunge et al. 1994); RS1/2 = X-linked juvenile retinoschisis (Huopaniemi et al. 1999); LPI = lysinuric protein intolerance (Torrents et al. 1999); Salla = Salla disease (Verheijen et al. 1999); SNP1 = WIAF-11062, SNP2 = WIAF-11091, SNP6 = WIAF-10964 (Cargill et al. 1999); SNP7 = HLA-H IVS2 (Beutler et al. 1996); SNP8 = HLA-H 5569 (Jeffrey et al. 1999) ; EPMR = progressive epilepsy with mental retardation (Ranta et al. 1999). (B) A fluorescence image of the array described in A obtained when 40 DNA samples were genotyped in duplicate (>2400 genotypes) by allele-specific primer extension. The genotype assignments for a larger number of samples based on numeric ratios from arrays are shown in Figures 3 and 4. (C) Enlargements of 16 individual arrays (a–p in B). The genotyping results from samples of mutation carriers and patients are indicated by the disease acronym and genotype below the array images. Both allele-specific primers give similar signal intensities in heterozygous samples, while only one of the primers gives a signal for homozygotes.
Figure 2
Figure 2
Strategy and result from high-throughput genotyping on allele-specific primer extension arrays. (A) The design of an array is illustrated schematically. Eighty separate reaction chambers have been formed on each microscope glass slide, using a 384-well formatted silicon rubber grid. Each of these reaction chambers contain an identical array of 72 primers for detection of 36 mutations or SNPs. The vertical columns (A–D) contain pairs of allele-specific primers for each site ordered into nine horizontal rows (1–9). The acronyms corresponding to the diseases and the mutant or variant nucleotides analyzed on the array are given in the lower part of A. INCL = infantile neuronal ceroid lipofuscinosis (Vesa et al. 1995); AGU = aspartylglucosaminuria (Ikonen et al. 1991); FV = Factor V Leiden (Bertina et al. 1994); CCD = congenital chloride diarrhea (Höglund et al. 1996); APECED = autoimmune polyendocrinopathy-candidiasis-ectodermal dystrophy (the Finnish-German APECED Consortium 1997); HTI = hereditary tyrosinemia type I (St-Louis et al. 1994); HFI = hereditary fructose intolerance (Cross et al. 1990); OAT1 & 2 = gyrate atrophy of the choroid and retina (Mitchell et al.1989); Batten = Batten disease (the International Batten Disease Consortium 1995); vLINCL = variant late infantile neuronal ceroid lipofuscinosis (Savukoski et al. 1998); NKH = nonketotic hyperglycinemia (Kure et al. 1992); CF Δ508/ΔTT394 = cystic fibrosis (Kere et al. 1994); A1AT = α1-antitrypsin deficiency Z-mutation (Cox et al. 1988); HH = hereditary hemochromatosis C282Y (Feder et al. 1996); DFNB=nonsyndromic deafness, connexin 26 35insG (Denoyelle et al. 1997); ODG = hypergonadotropic ovarian dysgenesis (Aittomaki et al. 1995); DTD = diastrophic dysplasia (Hästbacka et al. submitted); CNFmaj/min = congenital nephrosis (Kestilä et al. 1998); PKU R408W = phenylketonuria (Guldberg et al. 1995); MCAD = medium-chain acyl-CoA dehydrogenase deficiency (Matsubara et al. 1990); LCHAD = long-chain 3-hydroxyacyl-CoA dehydrogenase deficiency (Ijist et al. 1996); PT = prothrombin G20210A (Poort et al. 1996); MPS = mucopolysaccharidosis type I (Bunge et al. 1994); RS1/2 = X-linked juvenile retinoschisis (Huopaniemi et al. 1999); LPI = lysinuric protein intolerance (Torrents et al. 1999); Salla = Salla disease (Verheijen et al. 1999); SNP1 = WIAF-11062, SNP2 = WIAF-11091, SNP6 = WIAF-10964 (Cargill et al. 1999); SNP7 = HLA-H IVS2 (Beutler et al. 1996); SNP8 = HLA-H 5569 (Jeffrey et al. 1999) ; EPMR = progressive epilepsy with mental retardation (Ranta et al. 1999). (B) A fluorescence image of the array described in A obtained when 40 DNA samples were genotyped in duplicate (>2400 genotypes) by allele-specific primer extension. The genotype assignments for a larger number of samples based on numeric ratios from arrays are shown in Figures 3 and 4. (C) Enlargements of 16 individual arrays (a–p in B). The genotyping results from samples of mutation carriers and patients are indicated by the disease acronym and genotype below the array images. Both allele-specific primers give similar signal intensities in heterozygous samples, while only one of the primers gives a signal for homozygotes.
Figure 3
Figure 3
Scatter plots showing the genotype assignment at 31 mutant sites for 192 samples from known mutation carriers, homozygous patients, and unknown individuals. The acronyms for the diseases above each scatter-plot are as explained in the Figure 2A legend. The ratios between the signal intensities from the normal and mutant allele-specific reactions are given on the y-axis. The ratios are near the value 1 in heterozygotes, elevated in normal homozygotes, and reduced in mutant homozygotes. The x-axis shows the signal intensities from each sample after correction for the average local background signal from the arrays. The red asterisks in the heterozygote clusters indicate that synthetic templates were analyzed because no carrier samples were available.
Figure 4
Figure 4
Scatter plots showing the results from genotyping a panel of variant nucleotides in the factor V and the HLA-H genes. The SNPs from the FV gene had been selected from those described by Cargill et al. (1999). The polymorphism WIAF-10964 lies in exon 10 as the FVLeiden mutation (Bertina et al. 1994), while the other SNPs are located in exon 13 of the gene. The polymorphism IVS2 lies in intron 2 (Beutler et al. 1997), the HHC282Y mutation in exon 4 (Feder et al. 1996) and 5569A/G in intron 4 (Jeffrey et al. 1999) of the HLA-H gene. The six FV and two HLA-H gene SNPs, along with FVLeiden and HHC282Y mutations, were analyzed in 53 known FVLeiden mutation and in 84 known HHC282Y mutation carriers or homozygotes, and in 94 individuals known to be of normal genotype at both the mutant sites. The signal intensity ratios are given on the y-axis and the signal intensities on the x-axis.
Figure 5
Figure 5
Effect of template complexity on the allele-specific extension reaction on primer arrays. (A)Average signal intensity ratios and signal intensities, obtained when seven mutations amplified in a single 7-plex PCR (indicated by 7), were genotyped directly and at increased complexity in the presence of 22 additional (indicated as 7 + 22 = 29) and 99 additional (106) PCR fragments in similar molar amounts. A mixture containing all the other PCR fragments (99*), except the 7-plex PCR product, was included as control for the template-independent extension or cross reaction with nonspecific targets. The average signal intensity ratio (reflecting specific vs. misincorporation of CY5-dNTPs) and signal intensity from quadruplicate genotyping reactions were given the value 1 for the 7-plex PCR product. The signal intensity ratios and signal intensities for the complex mixtures are given in relation to this value. The standard deviations were calculated for the overall change in signal ratio and signal intensity for the seven analyzed mutant sites. (B) Agarose gel image of the mixtures of PCR products analyzed in the experiment described in A.
Figure 6
Figure 6
Detection of minority mutations in mixed samples with an excess of normal sequence by dual-color, allele-specific primer extension reactions. A control sample, which is a normal homozygote for all the tested mutations (0% mutant allele), was first analyzed on all the arrays by extension with CY3-labeled dNTPs. The same arrays were then subjected to a second round of extension, in which the mixed samples containing varying amounts of mutant allele were analyzed using CY5-labeled dNTPs in the allele-specific reactions. The acronyms for the mutations above each diagram are as in Figure 3. The proportion of mutant allele (%) in the samples is given below the diagrams. The CY-5 signal ratios between the mutant and normal alleles in the mixed samples normalized for the corresponding CY-3 ratios in the control sample and further normalized to 1 are given on the y-axis. The error bars show range of signal ratios in triplicate.
Figure 7
Figure 7
Optimization of the conditions of the allele-specific primer extension reaction. (A) Comparison of four RT enzymes for their efficiency in incorporating labeled dNTPs and for their genotyping specificity in the array-based primer extension reaction. The MMLV RT is not as processibe as AMV and SuperScript because it yields lower signal intensities, but the MMLV RT showed the highest discrimination against misprimed extension. (MMLV = Moloney murine leukemia virus reverse transcriptase; AMV RT = avian myeloblastosis virus reverse transcriptase.) (B) Enhancement of the efficiency of nucleotide incorporation and genotyping specificity of the MMLV enzyme by increased reaction temperature and the presence of the disaccharide trehalose. Normalized signal intensities and signal intensity ratios are given on the y-axis.

References

    1. Aittomaki K, Lucena JLD, Pakarinen P, Sistonen P, Tapanainen J, Gromoll J, Kaskikari R, Sankila EM, Lehväslaiho H, Engel AR, et al. Mutation in the follicle stimulating hormone receptor gene causes hereditary hypergonadotropic ovarian failure. Cell. 1995;82:959–968. - PubMed
    1. Bell GI, Karam JH, Rutter WJ. Polymorphic DNA region adjacent to the 5′ end of the human insulin gene. Proc Natl Acad Sci. 1981;78:5759–5763. - PMC - PubMed
    1. Bertina RM, Koeleman BPC, Koster T, Rosendaal FR, Dirven RJ, de Ronde H, van der Velden PA, Reitsma PH. Mutation in blood coagulation factor V associated with resistance to activated protein C. Nature. 1994;369:64–67. - PubMed
    1. Beutler E, West C, Gelbart T. HLA-H and associated proteins in patients with hemochromatosis. Mol Med. 1997;3:397–402. - PMC - PubMed
    1. Brown PO, Botstein D. Exploring the new world of the genome with DNA microarrays. Nat Genet. 1999;21:S33–S37. - PubMed

Publication types

LinkOut - more resources