

doi: 10.1101/gr.10.7.1051.
SAGEmap: a public gene expression resource
Affiliations
- PMID: 10899154
- PMCID: PMC310889
- DOI: 10.1101/gr.10.7.1051
Item in Clipboard
SAGEmap: a public gene expression resource
Genome Res.
2000 Jul.
Abstract
We have constructed a public gene expression data repository and online data access and analysis, WWW and FTP sites for serial analysis of gene expression (SAGE) data. The WWW and FTP components of this resource, SAGEmap, are located at http://www.ncbi.nlm.nih. gov/sage and ftp://ncbi.nlm.nih.gov/pub/sage, respectively. We herein describe SAGE data submission procedures, the construction and characteristics of SAGE tags to gene assignments, the derivation and use of a novel statistical test designed specifically for differential-type analyses of SAGE data, and the organization and use of this resource.
Figures
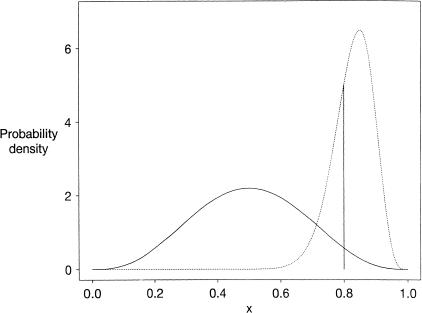
The solid curve represents an assumed prior probability density for x, given within a normalizing constant by f(x) = x3(1-x)3. The prior probability that the mRNA concentration y is at least 4 times z is represented by the area beneath this curve and to the right of the vertical line at x=0.8, or about 3.3%. Assume that 25 tags corresponding to the mRNA in question are then sequenced from the Y cells, and two tags from the Z cells, in an experiment in which the same total number of tags are sequenced from each of the two cell types. The posterior probability density for x is then proportional to g(x) = x28(1-x)5, represented by the dotted curve. The posterior probability that x ≥0.8 is approximately 70.0%.
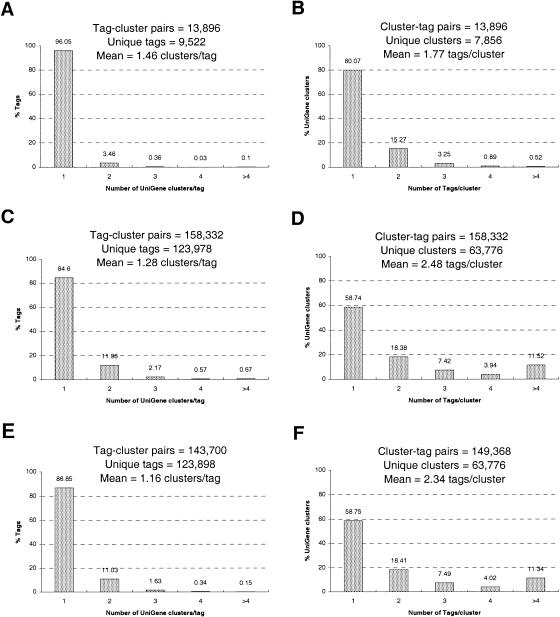
(A,B) The percent distributions of the tag-to-gene and gene-to-tag mappings, respectively, from October 1999, for well-characterized mRNA/cDNA sequences only (i.e., no EST sequences). (C,D) The distributions for the “full” mappings (including data from tags paired to UniGene clusters). (E,F) The distributions for the “reliable” mappings (see text).
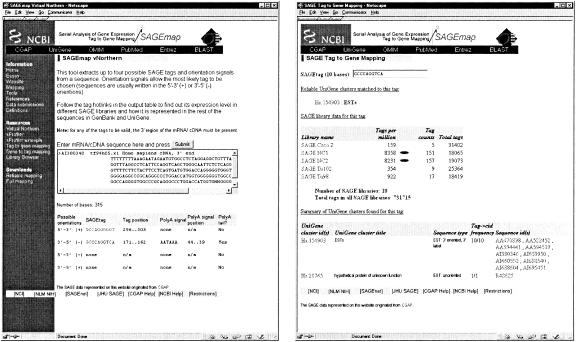
Pasting text sequence information into the text box and clicking on the “Submit” button (left) retrieves the tag and orientation information given below the text box. Tags are given in four possible sequence orientations, the top two orientations being the most common. The correct tag and orientation can be chosen based on the poly-adenylation signal and tail location/presence information. Clicking on the tag (left) will retrieve tag-to-gene mapping information (right) including reliable gene assignment; relative and absolute tag abundance in the SAGE libraries currently in the NCBI SAGE repository; and every UniGene identifier, type, orientation, frequency, and GenBank Accession numbers for each GenBank and dbEST sequence which contained that tag. The information in the right panel can also be retrieved by typing in the 10-base tag sequence in the search box at the top of the page. This same information for UniGene clusters can be retrieved with a similar search interface (not shown) which is located at http://www.ncbi.nlm.nih.gov/SAGE/SAGEcid.cgi .
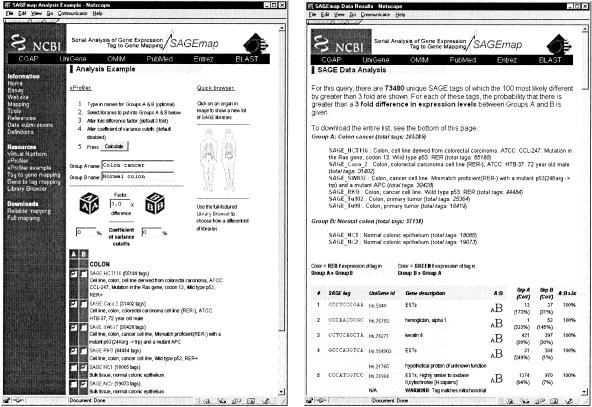
This is an example comparison of colon carcinoma libraries and normal colon libraries. (Left) Names can be chosen for groups A and B, if desired, and the factor parameter upon which the comparison statistic is based; the coefficient of variance cutoffs are set (see text); libraries which are to be put into groups A and B are selected, and the “Calculate” button is pressed. Results are returned in a new window (right), which gives a synopsis of the comparison at the top, lists the names and descriptions of libraries in groups A and B, and results of the statistical comparison (with tag gene assignments) appearing in the lower part of the browser window (see text). In addition, the results of the comparison may be downloaded to a local computer for further analysis.
References
-
- Aaronson JS, Eckman B, Blevins RA, Borkowski JA, Myerson J, Imran S, Elliston KO. Toward the development of a gene index to the human genome: an assessment of the nature of high-throughput EST sequence data. Genome Res. 1996;6:829–845. - PubMed
-
- Audic S, Claverie J-M. The significance of digital gene expression profiles. Genome Res. 1997;7:986–995. - PubMed
-
- Boguski MS, Lowe TM, Tolstoshev CM. dbEST—database for “expressed sequence tags.”. Nat Genet. 1993;4:332–333. - PubMed
-
- DeRisi JL, Iyer VR, Brown PO. Exploring the metabolic and genetic control of gene expression on a genomic scale. Science. 1997;278:680–686. - PubMed
MeSH terms
LinkOut - more resources
Full Text Sources
Other Literature Sources