. 2000 Jul;84(1):216-35.
doi: 10.1152/jn.2000.84.1.216.

Apparent motion produces multiple deficits in visually guided smooth pursuit eye movements of monkeys

Affiliations

Apparent motion produces multiple deficits in visually guided smooth pursuit eye movements of monkeys

M M Churchland et al. J Neurophysiol. 2000 Jul.

Abstract

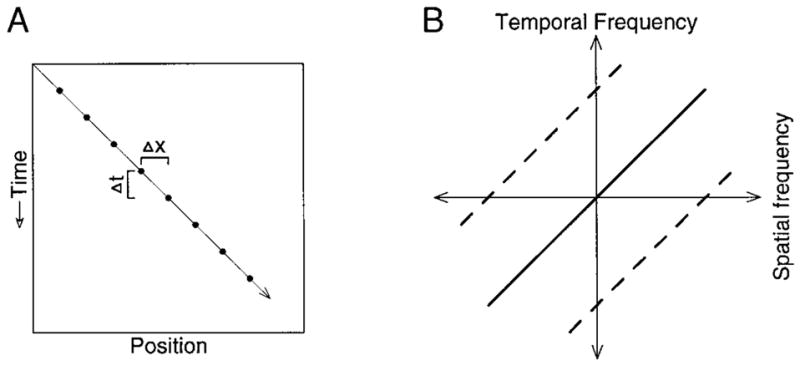
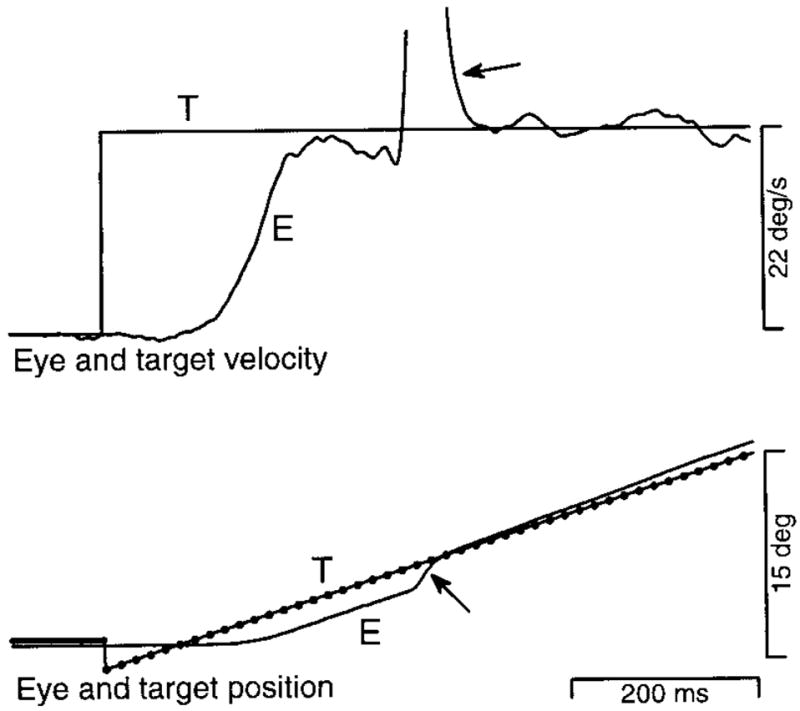
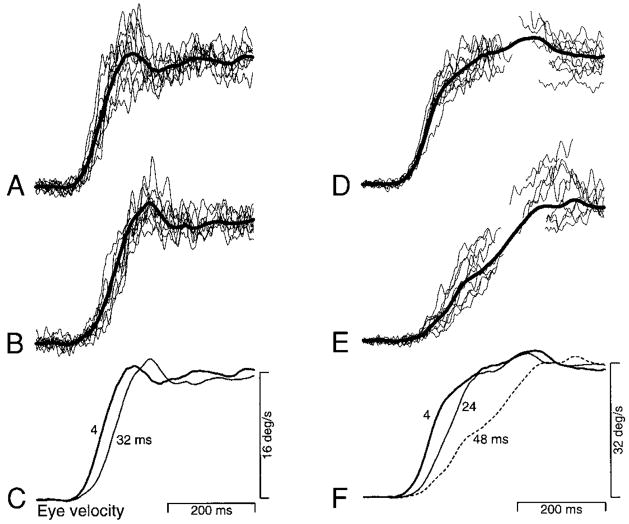
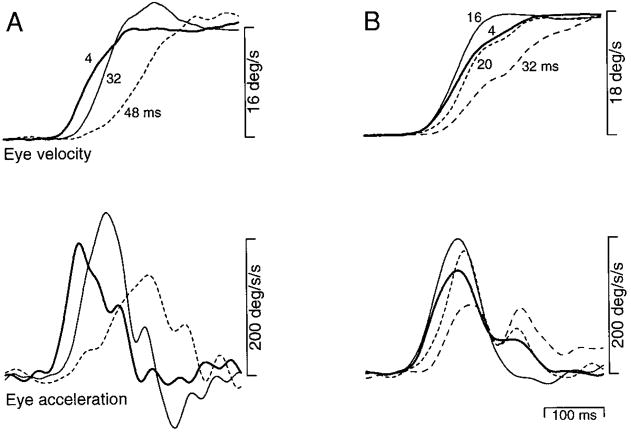
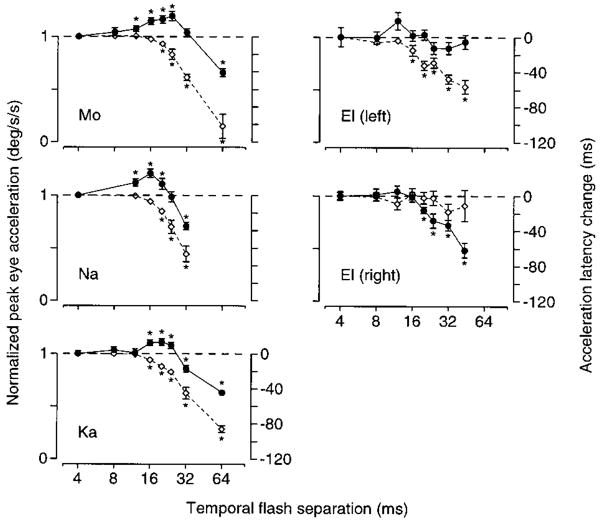
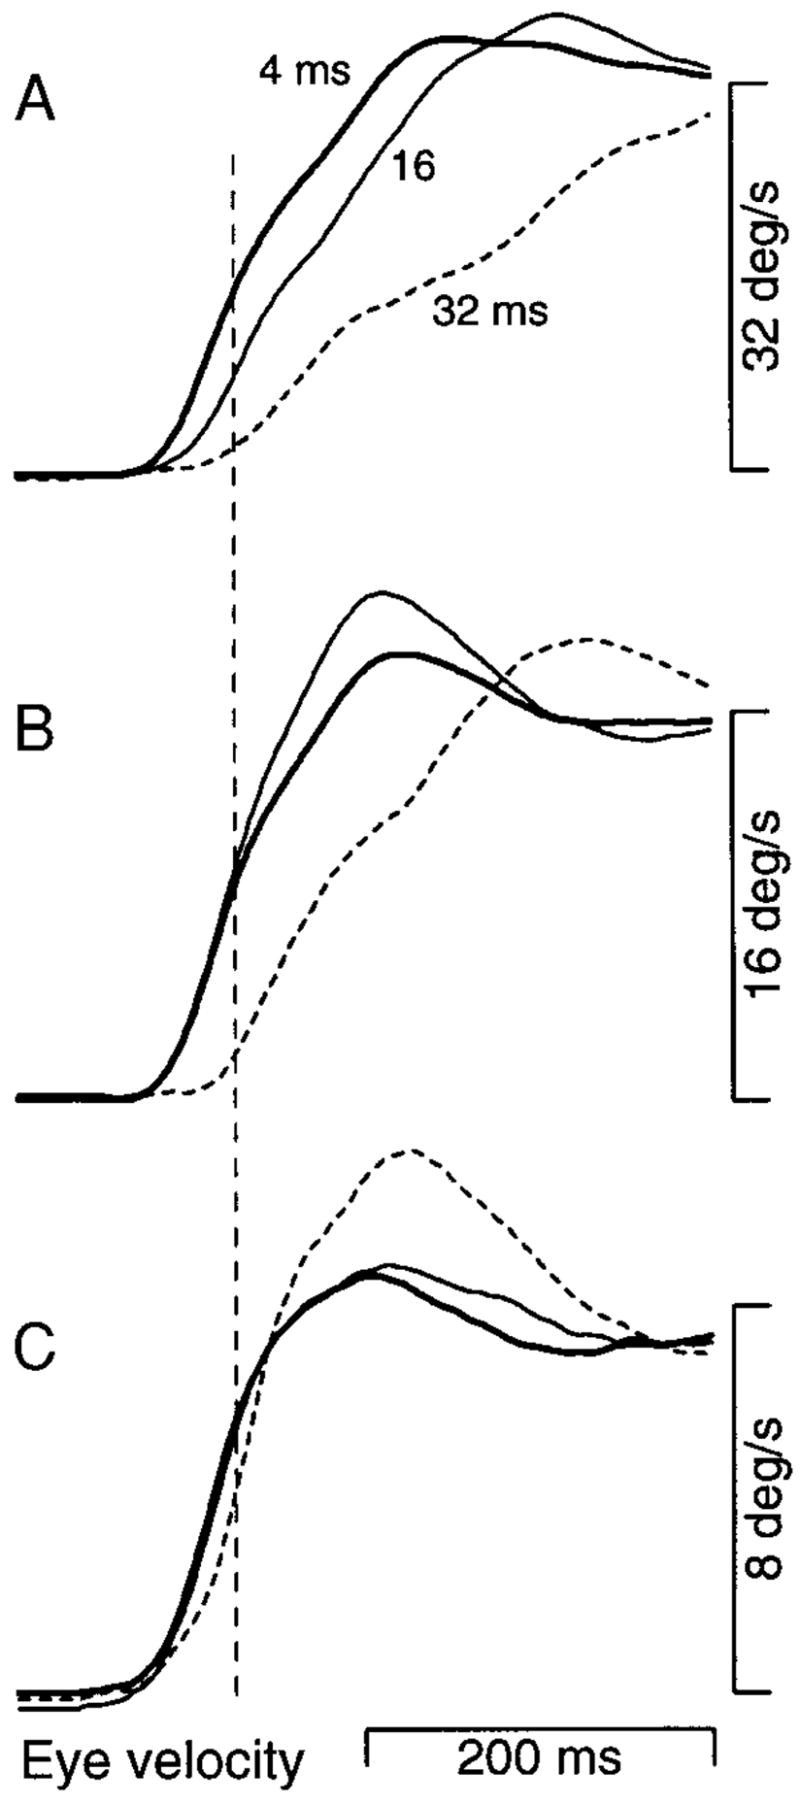
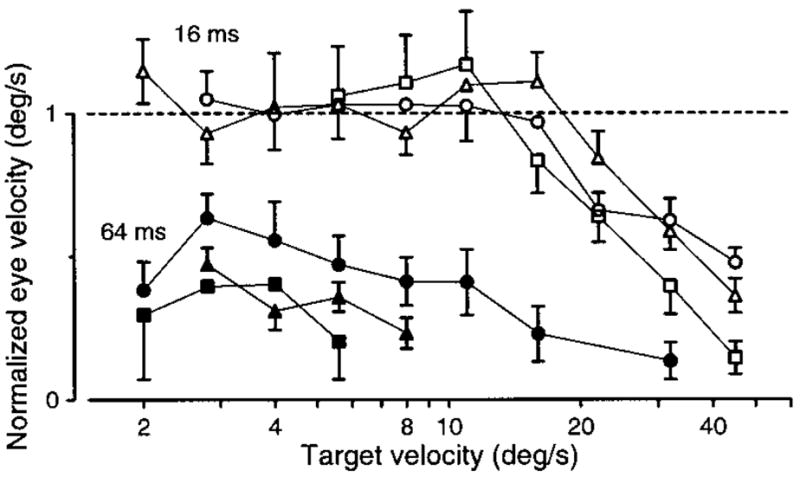
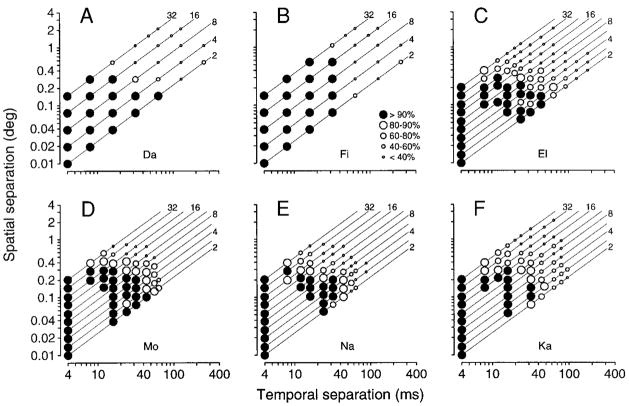
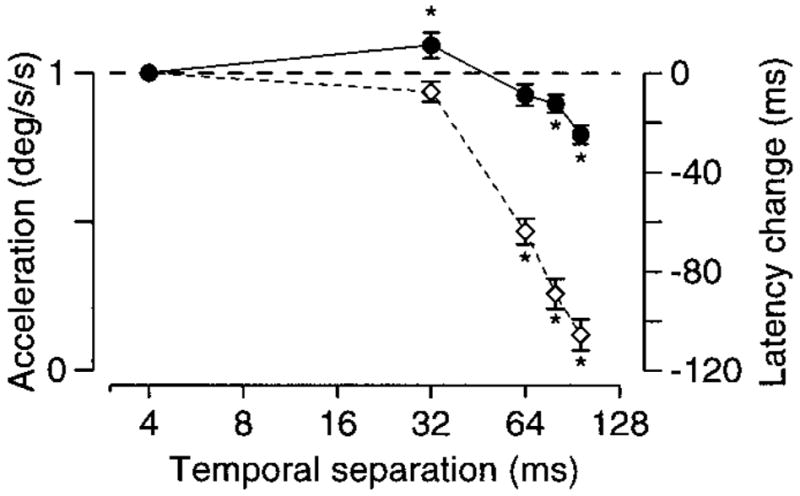
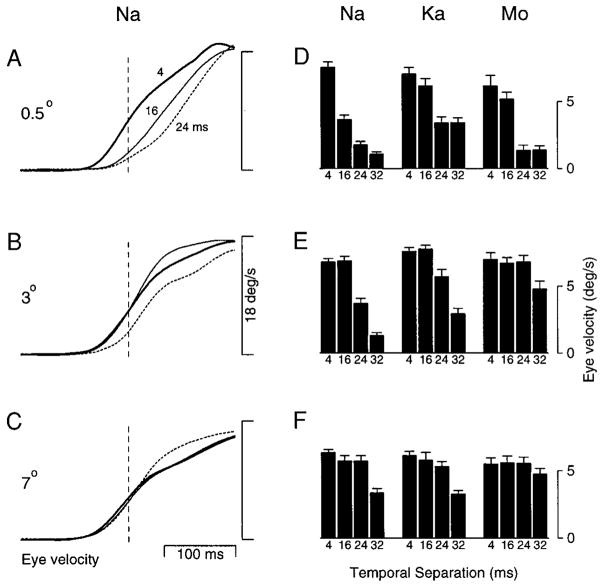
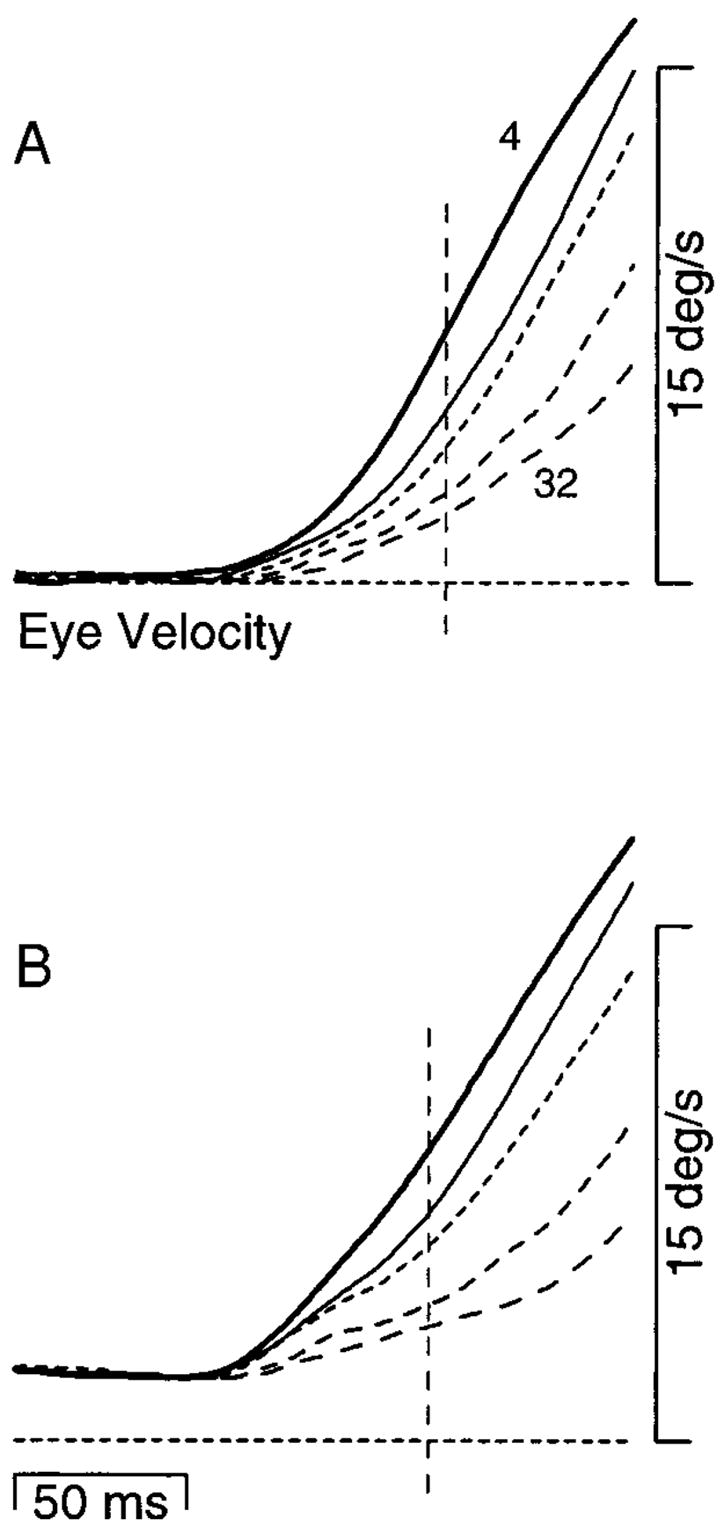
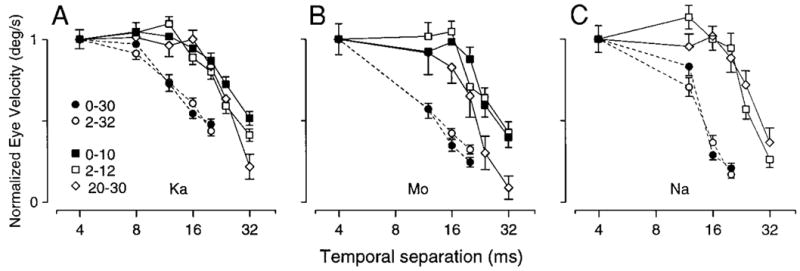
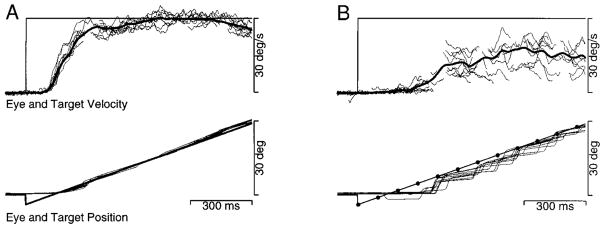
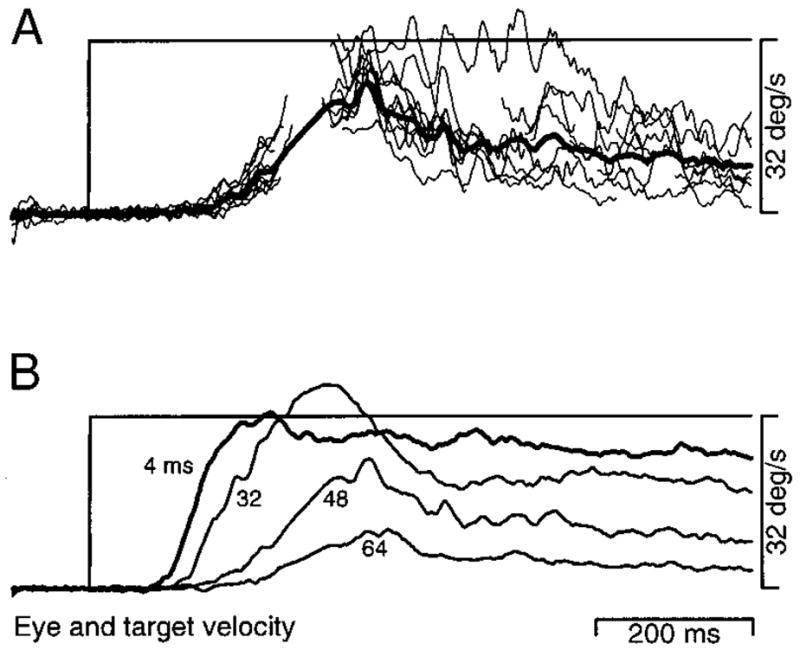
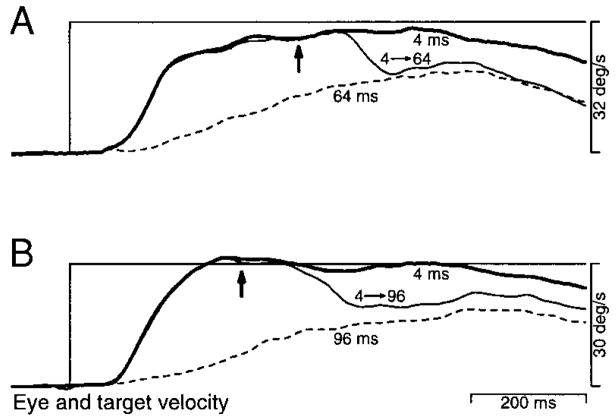
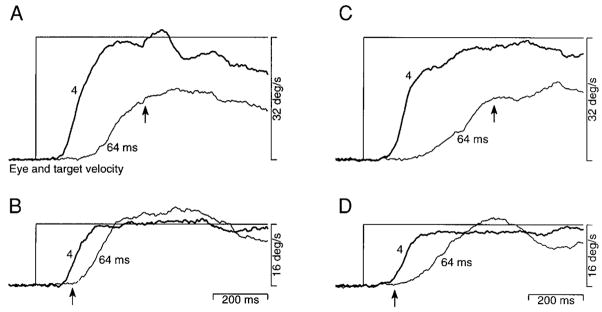
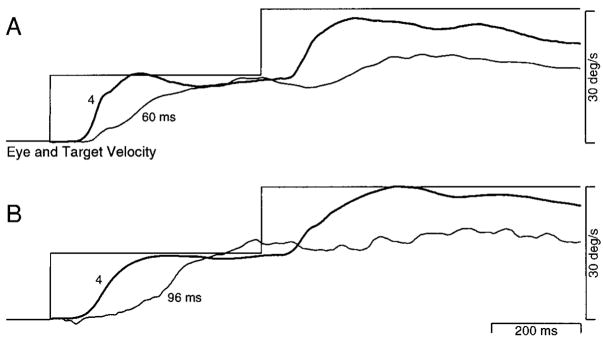
We used apparent motion targets to explore how degraded visual motion alters smooth pursuit eye movements. Apparent motion targets consisted of brief stationary flashes with a spatial separation (Deltax), temporal separation (Deltat), and apparent target velocity equal to Deltax/Deltat. Changes in pursuit initiation were readily observed when holding target velocity constant and increasing the flash separation. As flash separation increased, the first deficit observed was an increase in the latency to peak eye acceleration. Also seen was a paradoxical increase in initial eye acceleration. Further increases in the flash separation produced larger increases in latency and resulted in decreased eye acceleration. By varying target velocity, we were able to discern that the visual inputs driving pursuit initiation show both temporal and spatial limits. For target velocities above 4-8 degrees /s, deficits in the initiation of pursuit were seen when Deltax exceeded 0.2-0.5 degrees, even when Deltat was small. For target velocities below 4-8 degrees /s, deficits appeared when Deltat exceeded 32-64 ms, even when Deltax was small. Further experiments were designed to determine whether the spatial limit varied as retinal and extra-retinal factors changed. Varying the initial retinal position of the target for motion at 18 degrees /s revealed that the spatial limit increased as a function of retinal eccentricity. We then employed targets that increased velocity twice, once from fixation and again during pursuit. These experiments revealed that, as expected, the spatial limit is expressed in terms of the flash separation on the retina. The spatial limit is uninfluenced by either eye velocity or the absolute velocity of the target. These experiments also demonstrate that "initiation" deficits can be observed during ongoing pursuit, and are thus not deficits in initiation per se. We conclude that such deficits result from degradation of the retino-centric motion signals that drive pursuit eye acceleration. For large flash separations, we also observed deficits in the maintenance of pursuit: sustained eye velocity failed to match the constant apparent target velocity. Deficits in the maintenance of pursuit depended on both target velocity and Deltat and did not result simply from a failure of degraded image motion signals to drive eye acceleration. We argue that such deficits result from a low gain in the eye velocity memory that normally supports the maintenance of pursuit. This low gain may appear because visual inputs are so degraded that the transition from fixation to tracking is incomplete.


Figures

FIG. 1
FIG. 1
Representation of smooth and apparent motion in the space-time domain (A), and the frequency domain (B). A: time is shown on the y-axis, with downward movement along the axis reflecting the passing of time. Horizontal position is plotted on the x-axis. B: frequency domain representation of the same target motion as in A. Spatial and temporal frequency are plotted on the x- and y-axis with positive values plotted rightward and upward, respectively. The oblique solid line shows the relationship for real target motion at a given speed, while the 2 dashed oblique lines show “replicas” that appear during sampled, or apparent, motion.
FIG. 2
FIG. 2
Single trial record showing a representative response to target motion at an apparent velocity of 22°/s, with a Δt of 16 ms. The top and bottom pairs of traces superimpose target (T) and eye (E) velocity and position, respectively. The dots on the target position trace indicate the time and position of each flash of the apparent motion target. The arrow on the eye position trace points out a saccade. The arrow on the eye velocity trace points out the (truncated) rapid upward deflection caused by the saccade. The traces begin 100 ms before the step-ramp of target motion, and about 1,000 ms after the onset of the trial. Upward deflections of the traces indicate rightward motion.
FIG. 3
FIG. 3
Effect of varying Δt on the time course of the initiation of pursuit in one monkey. In A, B, D, and E, the fine and bold traces show 10 subsequent individual responses and averages of all 17–20 responses, respectively. A: responses to apparent target velocity of 16°/s when Δt was 4 ms. B: responses to apparent target velocity of 16°/s when Δt was 32 ms. C: the average responses from A and B are shown superimposed for comparison. Numbers next to each trace indicate the value of Δt used to obtain that average. D: responses to apparent target velocity of 32°/s when Δt was 4 ms. E: responses to apparent target velocity of 32°/s when Δt was 48 ms. F: the average responses from D and E are shown superimposed for comparison, along with the average response when Δt was 24 ms. All traces begin at the onset of target motion. Traces for individual responses are interrupted during saccades. Both target motion and the pursuit response continued for 500–1,000 ms after the portion of the response shown. These examples were drawn from experiments using multiple target velocities in monkey Ka, and not from the experiments shown in Figs. 4 or 5. Although flash separation is indicated in terms of Δt, Δx and Δt change together for target motion at a constant speed.
FIG. 4
FIG. 4
Effect of varying Δt on the time course of average eye velocity and acceleration. Top and bottom groups of superimposed traces show average eye velocity and acceleration for multiple values of Δt. A: responses of monkey Ka to an apparent target velocity of 16°/s. Numbers next to the eye velocity traces indicate the value of Δt. Data were taken from an experiment using a range of velocities. B: responses of monkey Na to an apparent target velocity of 18°/s. Data were taken from an experiment using only one target velocity. For the data shown in both A and B, saccades occurred well after the peak of eye acceleration except for the longest values of Δt when they occurred just following the peak. Traces begin at the onset of target motion.
FIG. 5
FIG. 5
Separate effects of varying Δt on peak eye acceleration and acceleration latency for 4 monkeys. ●, peak eye acceleration; ◇, acceleration latency as a function of Δt. Apparent target velocity was 18°/s for monkeys Mo, Na, and Ka and 16°/s for monkey El. Acceleration was normalized by the average value when Δt was 4 ms and is plotted relative to the left-hand vertical axis. Latency is shown as the time shift from the average value when Δt was 4 ms and is plotted against the right-hand vertical axis. Values below the dashed line indicate decreases in acceleration and increases in latency. Error bars show the standard error of the mean and are omitted when smaller than the symbol. Asterisks indicate significant changes from the values at 4 ms (2-tailed t-test, P < 0.05). Graphs for monkeys Mo, Na, and Ka show responses to rightward target motion taken from experiments using a single apparent target velocity. Both directions are shown for monkey El, who exhibited an exceptional pattern of deficits in his rightward pursuit only.
FIG. 6
FIG. 6
Average eye velocity traces showing how the effect of varying Δt depends on the apparent target velocity. Apparent target velocities were 32°/s (A), 16°/s (B), and 8°/s (C). The different trace types show responses for different values of Δt: bold, 4 ms; fine, 16 ms; short dashes, 32 ms. Traces begin at the onset of target motion. To allow comparison of deficits, responses are scaled relative to the target velocity that evoked them. The vertical dashed line was placed 50 ms after the onset of pursuit when Δt was 4 ms and illustrates how we selected a measurement time that was used to extract the eye velocity measure used in later figures. Data were obtained from monkey Mo in an experiment that used only 3 target velocities. Each average was constructed from at least 45 individual traces.
FIG. 7
FIG. 7
Effect of varying apparent target velocity on the initiation of pursuit at 2 values of Δt. The y-axis plots normalized average eye velocity measured 50 ms after the initiation of normal pursuit. The time of initiation of normal pursuit was measured when Δt was 4 ms and was measured separately for each apparent velocity. The average eye velocity for a given Δt is normalized by the average eye velocity for normal pursuit; i.e., when Δt was 4 ms. The horizontal dashed line shows a normalized eye velocity of one, which would indicate that eye velocity was the same as when Δt was 4 ms. Values below the dashed line indicate deficits. Open and filled symbols show responses when Δt was 16 and 64 ms. Different symbol shapes show data for monkeys Mo (triangles), Na (squares), and Ka (circles). Error bars show the standard error of the mean. Overlapping error bars have been suppressed.
FIG. 8
FIG. 8
Temporal and spatial limits of apparent motion for the initiation of normal pursuit. Each graph contains one symbol for each combination of temporal separation (Δt) and spatial separation (Δx). The symbol type expresses mean eye velocity as a percentage of that evoked by targets of the same apparent velocity but with a Δt of 4 ms: large solid circles, eye velocity within 90% of normal; large open circles, eye velocity within 80–90% of normal; progressively smaller circles indicate progressively slower eye velocities as defined by the key in B. The diagonal lines correspond to fixed values of apparent target velocity, indicated by the numbers along the top and right edges of each panel. A and B: experiments designed to tile a large range of possible values of Δt and Δx (monkeys Da and Fi). C–F: experiments using a closer spacing of values of Δt and Δx over a more limited range, to allow a more complete sampling of the range where pursuit initiation becomes impaired (monkeys El, Mo, Na, and Ka). Each point is based on the mean eye velocity in a 20-ms interval centered 70 ms after the initiation of normal pursuit for monkeys Da, Fi, and El, and centered 50 ms after the initiation of pursuit for monkeys Mo, Na, and Ka.
FIG. 9
FIG. 9
Effect of varying Δt on the initiation of pursuit for a target velocity of 3°/s. Filled symbols show eye acceleration, normalized to the average value when Δt was 4 ms and plotted relative to the left-hand vertical axis. Open symbols show latency, calculated as the time-to-peak eye acceleration and plotted relative to the right-hand vertical axis as the time shift from the average value when Δt was 4 ms. Values below the dashed line indicate decreases in acceleration and increases in latency. Asterisks mark data points that differed significantly from the value when Δt was 4 ms (2-tailed t-test, P < 0.05). Error bars show the standard error of the mean and are omitted when obscured by the symbols. Data are from monkey Ka.
FIG. 10
FIG. 10
Effect of target eccentricity on the initiation of pursuit to apparent motion. Each row of traces and bar graphs shows data for a single starting target eccentricity. A and D: 0.5°. B and E: 3°. C and F: 7°. A–C: average eye velocity responses of monkey Na to apparent target velocity at 18°/s. Bold, fine, and dashed traces show responses when Δt was 4, 16, and 24 ms, respectively. Traces begin at the onset of target motion. Vertical dashed lines show the measurement time used to create the bar graphs, 50 ms after the initiation of pursuit when Δt was 4 ms. Each trace is an average constructed from at least 40 responses to a given apparent target motion. D–F: bar graphs showing eye velocity, measured at the time of the dashed line, as a function of Δt for 3 monkeys. In each panel, the 3 groups of histogram bars show data from 3 monkeys. Each group of 4 bars summarizes the effect of Δt for a given monkey at one eccentricity. Numbers below each bar indicate the value of Δt used to obtain those data. Error bars show the standard error of the mean.
FIG. 11
FIG. 11
Effect of initial target velocity on responses to a 30°/s step of apparent target velocity using multiple values of Δt. A: initial target velocity was 0°/s and the step took target velocity to 30°/s. B: initial target velocity was 2°/s and the step took target velocity to 32°/s. Different trace types show average eye velocity for different values of Δt: bold traces, 4 ms; thin traces, 12 ms; small dashes, 16 ms; medium dashes, 24 ms; long dashes, 32 ms. The horizontal dashed lines mark 0°/s. Vertical dashed lines are placed 50 ms after the start of the response when Δt was 4 ms and show when the eye velocity measurements plotted in Fig. 12 were made.
FIG. 12
FIG. 12
Quantitative analysis of the effect of initial target/eye velocity on the response to steps of target velocity as a function of Δt. The 3 graphs show data from 3 monkeys. Each graph plots the normalized eye velocity response as a function of Δt for steps of apparent target velocity imposed both at the initiation and during maintenance of pursuit. Each response was normalized by dividing the mean eye velocity response by that for the same conditions when Δt was 4 ms. When steps of target velocity were imposed at the initiation of pursuit, we measured eye velocity 50 ms after the onset of the response when Δt was 4 ms. When steps of target velocity were imposed during the maintenance of pursuit, we measured the change in eye velocity by subtracting eye velocity 10 ms before the start of the response from that measured 50 ms after. Different symbols indicate different initial target velocities and velocity step sizes. Filled symbols plot responses to target steps imposed during fixation of a stationary target: 10°/s (filled squares) and 30°/s (filled circles). Open symbols plot responses to target velocity steps imposed during pursuit of a moving target: from 2 to 32°/s (open circles), from 2 to 12°/s (open squares), and from 20 to 30°/s (open diamonds). Error bars show the standard error of the mean.
FIG. 13
FIG. 13
Examples of the time course of eye velocity and position during apparent motion that caused deficits in the maintenance of pursuit. The top and bottom sets of traces show eye and target velocity and position when Δt was 4 ms (A) and 96 ms (B). Bold eye velocity traces show averages made after replacing saccades with straight line interpolations. Averages were made from 31 trials for A and 16 trials for B. Fine velocity and position traces show responses from 10 consecutive individual trials. In the individual eye velocity traces, the blank intervals indicate the times of saccades. The dots on the target position trace in B indicate the time and position of each flash of the apparent motion target. Data are from monkey Na.
FIG. 14
FIG. 14
Effect of varying Δt on deficits in the maintenance of pursuit for target motion at 32°/s. A: eye velocity traces showing responses when Δt was 48 ms. Fine traces show 10 consecutive individual responses, with saccades replaced by blank intervals. Bold trace shows the average eye velocity after saccadic deflections of eye velocity had been replaced with straight line segments. B: average eye velocity when Δt was 4, 32, 48, and 64 ms. Averages were computed from 10 to 15 trials taken from the same experiment on monkey Fi that produced Fig. 8B.
FIG. 15
FIG. 15
Demonstration that deficits in the maintenance of pursuit result from a failure of eye velocity memory. Each panel shows a step of target velocity and 3 averages of eye velocity. A: responses of monkey Da when apparent target velocity was 32°/s. B: responses of monkey Mo when apparent target velocity was 30°/s. Different line types show different sequences of Δt: bold traces, Δt was 4 ms throughout the trial; dashed traces, Δt was 64 ms (A) or 96 ms (B) throughout the trial; fine traces, Δt was initially 4 ms, then increased to 64 ms (A) or 96 ms (B) at the times marked by the arrows. Each average trace was computed from at least 15 trials.
FIG. 16
FIG. 16
Examples demonstrating that during deficient maintenance of pursuit, eye acceleration is much less than expected given the residual retinal image motion. A and B: results of an experiment using monkey El. For these panels, upward deflections represent leftward motion. C and D: results of an experiment using monkey Da. The 4 panels show averages of eye velocity for targets moving at apparent velocities of 32°/s (A and C) and 16°/s (B and D). Bold traces show responses when Δt was 4 ms and fine traces show responses when Δt was 64 ms. The arrows on the fine traces show the moments when image velocity (the difference of target and eye velocity) was 16°/s, so that the physical stimulus on the retina was the same at this point in the top and bottom panels. Each average trace was computed from about 15 trials.
FIG. 17
FIG. 17
Experiments demonstrating that the appearance of maintenance deficits does not depend solely on the retinal image motion. Each panel shows average eye velocity for apparent target velocities that stepped 1st from 0 to 15°/s and subsequently from 15 to 30°/s. A: responses of monkey Mo. B: responses of monkey Na. Bold traces show average eye velocity when Δt was 4 ms. Fine traces show average eye velocity when Δt was 60 ms (A) or 96 ms (B). Each average was computed from 30 or more trials. Neither the 1st nor the 2nd step of target velocity was accompanied by a step of target position.

References

    1. Adelson EH, Bergen JR. Spatiotemporal energy models for the perception of motion. J Opt Soc Am A. 1985;2:284–299. - PubMed
    1. Baker CJ, Braddick OJ. Temporal properties of the short-range process in apparent motion. Perception. 1985;14:181–192. - PubMed
    1. Barlow H, Levick WR. The mechanism of directionally selective units in rabbit’s retina. J Physiol (Lond) 1965;178:477–504. - PMC - PubMed
    1. Barnes GR, Asselman PT. Pursuit of intermittently illuminated moving targets in the human. J Physiol (Lond) 1992;445:617–637. - PMC - PubMed
    1. Boussaoud D, Desimone R, Ungerleider LG. Subcortical connections of visual areas MST and FST in macaques. Vis Neurosci. 1992;9:291–302. - PubMed

Publication types

LinkOut - more resources