. 2000 Jul 17;192(2):219-26.
doi: 10.1084/jem.192.2.219.

Natural interferon alpha/beta-producing cells link innate and adaptive immunity

Affiliations

Natural interferon alpha/beta-producing cells link innate and adaptive immunity

N Kadowaki et al. J Exp Med. .

Abstract

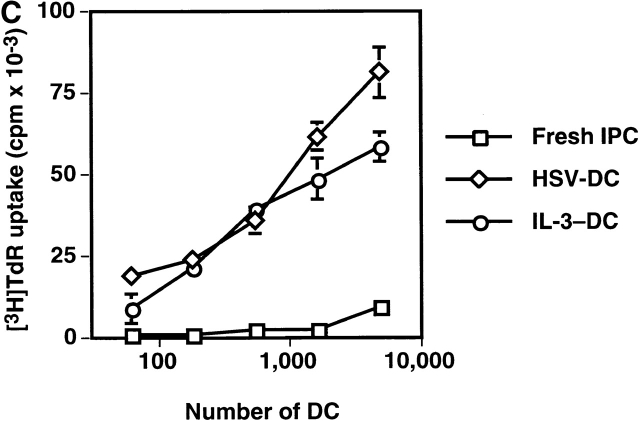
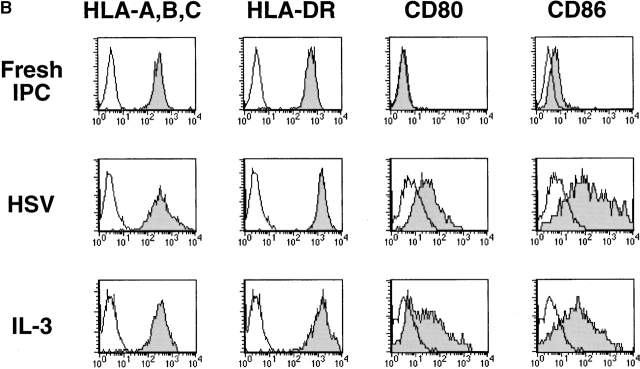
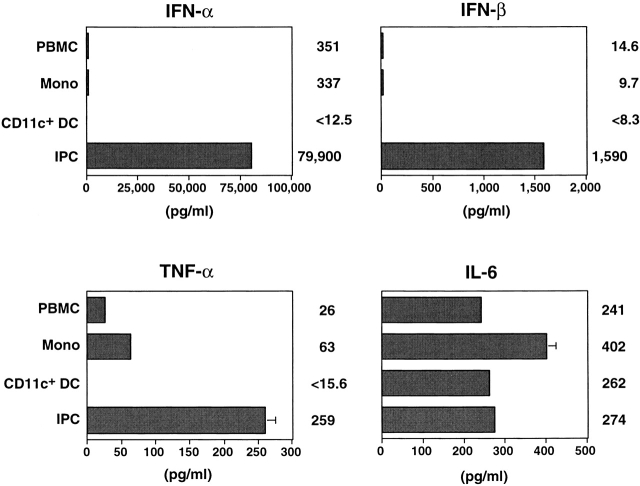
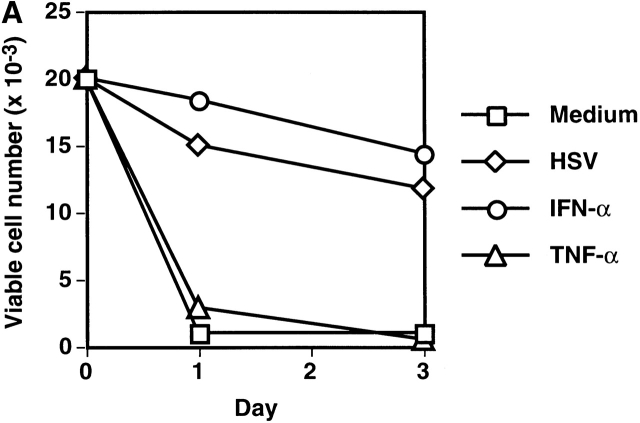
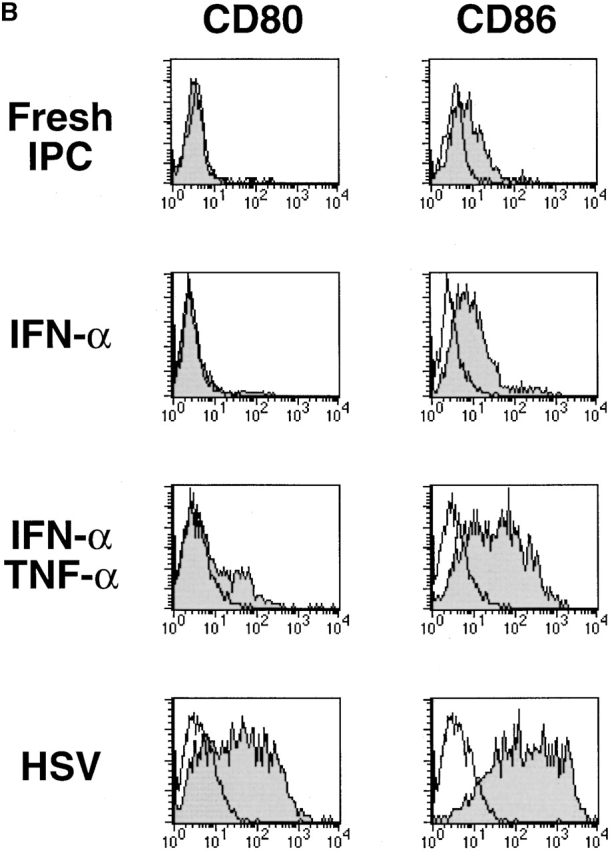
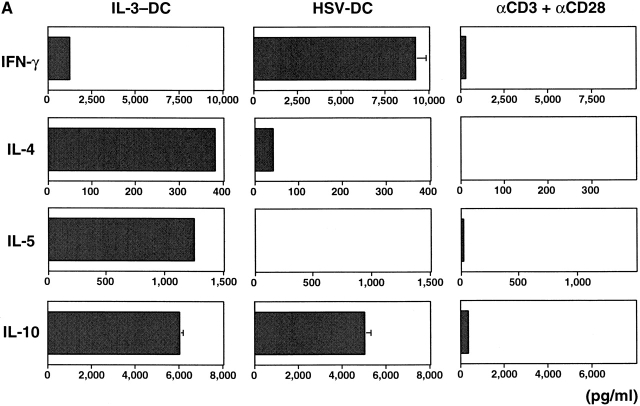
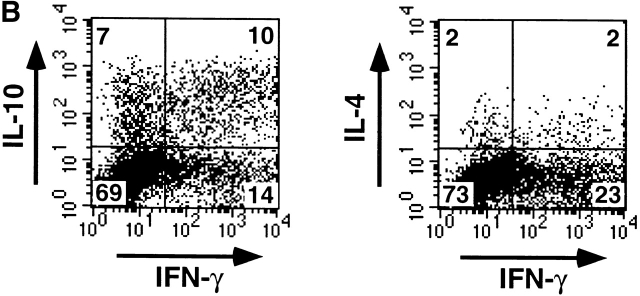
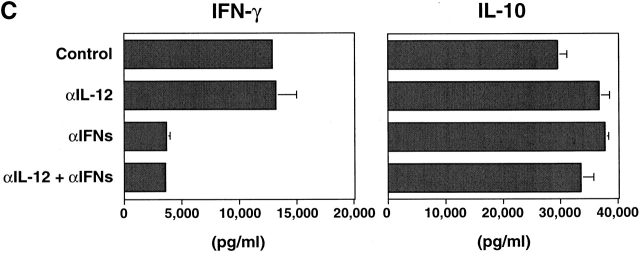
Innate immune responses to pathogens critically impact the development of adaptive immune responses. However, it is not completely understood how innate immunity controls the initiation of adaptive immunities or how it determines which type of adaptive immunity will be induced to eliminate a given pathogen. Here we show that viral stimulation not only triggers natural interferon (IFN)-alpha/beta-producing cells (IPCs) to produce vast amounts of antiviral IFN-alpha/beta but also induces these cells to differentiate into dendritic cells (DCs). IFN-alpha/beta and tumor necrosis factor alpha produced by virus-activated IPCs act as autocrine survival and DC differentiation factors, respectively. The virus-induced DCs stimulate naive CD4(+) T cells to produce IFN-gamma and interleukin (IL)-10, in contrast to IL-3-induced DCs, which stimulate naive CD4(+) T cells to produce T helper type 2 cytokines IL-4, IL-5, and IL-10. Thus, IPCs may play two master roles in antiviral immune responses: directly inhibiting viral replication by producing large amounts of IFN-alpha/beta, and subsequently triggering adaptive T cell-mediated immunity by differentiating into DCs. IPCs constitute a critical link between innate and adaptive immunity.


Figures

Figure 1
Figure 1
HSV induces differentiation of IPCs into DCs. (A) Cell numbers of IPCs cultured in different conditions. Viable cells were counted by trypan blue exclusion. The data shown are representative of three experiments. (B) Phenotype of fresh IPCs, HSV-stimulated IPCs, and IL-3–stimulated IPCs. Open histograms represent cells stained with isotype-matched control mAbs. The data shown are representative of four experiments. (C) Allogeneic mixed lymphocyte reaction. Naive CD4+ T cells from cord blood were cocultured with different numbers of fresh IPCs, HSV-DCs, or IL-3–DCs for 6 d. Error bars indicate SD. The data shown are representative of five experiments.
Figure 1
Figure 1
HSV induces differentiation of IPCs into DCs. (A) Cell numbers of IPCs cultured in different conditions. Viable cells were counted by trypan blue exclusion. The data shown are representative of three experiments. (B) Phenotype of fresh IPCs, HSV-stimulated IPCs, and IL-3–stimulated IPCs. Open histograms represent cells stained with isotype-matched control mAbs. The data shown are representative of four experiments. (C) Allogeneic mixed lymphocyte reaction. Naive CD4+ T cells from cord blood were cocultured with different numbers of fresh IPCs, HSV-DCs, or IL-3–DCs for 6 d. Error bars indicate SD. The data shown are representative of five experiments.
Figure 2
Figure 2
Cytokine production by different populations of blood cells stimulated with HSV. Cells were stimulated with HSV for 24 h, and cytokine concentrations in the supernatants were measured by ELISA. PBMC, total PBMCs; Mono, monocytes; CD11c+ DC, FACS-sorted CD11c+lin immature DCs; IPC, FACS®-sorted CD4+ CD11clin cells. Error bars indicate SD. The data shown are representative of four experiments.
Figure 3
Figure 3
IFN-α and TNF-α function as autocrine survival and differentiation factors of IPCs, respectively. (A) Cell numbers of IPCs cultured without stimulation or with HSV, IFN-α, or TNF-α. Viable cells were counted by trypan blue exclusion. The data shown are representative of three experiments. (B) Expression of CD80 and CD86 on fresh IPCs and IPCs cultured with IFN-α, IFN-α and TNF-α, or HSV for 3 d. Few cells remained viable in culture with TNF-α alone, as shown in A. Open histograms represent cells stained with isotype-matched control mAbs. The data shown are representative of four experiments.
Figure 3
Figure 3
IFN-α and TNF-α function as autocrine survival and differentiation factors of IPCs, respectively. (A) Cell numbers of IPCs cultured without stimulation or with HSV, IFN-α, or TNF-α. Viable cells were counted by trypan blue exclusion. The data shown are representative of three experiments. (B) Expression of CD80 and CD86 on fresh IPCs and IPCs cultured with IFN-α, IFN-α and TNF-α, or HSV for 3 d. Few cells remained viable in culture with TNF-α alone, as shown in A. Open histograms represent cells stained with isotype-matched control mAbs. The data shown are representative of four experiments.
Figure 4
Figure 4
IL-3–DCs and HSV-DCs induce different types of differentiation of naive CD4+ T cells. Allogeneic naive CD4+ T cells were cultured for 6 d with IL-3–DCs, HSV-DCs, or anti-CD3 and anti-CD28. T cells were restimulated with anti-CD3 and anti-CD28 for 24 h (A) or 48 h (C) for ELISA or for 5 h for intracellular staining (B). (A) Quantitation of IFN-γ, IL-4, IL-5, and IL-10 by ELISA. Error bars indicate SD. The data shown are representative of four experiments. (B) Intracellular IFN-γ, IL-4, and IL-10 staining of T cells cultured with HSV-DCs. The percentages in each quadrant are indicated on the plot. The data shown are representative of three experiments. (C) IFN-γ and IL-10 production by T cells cultured with HSV-DCs in the presence of neutralizing anti–IL-12 mAb and/or a mixture of anti–IFN-α, anti–IFN-β, and IFN-α/β receptor Abs. The same concentration of anti–IL-12 mAb inhibited IFN-γ production by T cells cultured with anti-CD3, anti-CD28, and 10 ng/ml IL-12 (data not shown). Error bars indicate SD. The data shown are representative of three experiments.
Figure 4
Figure 4
IL-3–DCs and HSV-DCs induce different types of differentiation of naive CD4+ T cells. Allogeneic naive CD4+ T cells were cultured for 6 d with IL-3–DCs, HSV-DCs, or anti-CD3 and anti-CD28. T cells were restimulated with anti-CD3 and anti-CD28 for 24 h (A) or 48 h (C) for ELISA or for 5 h for intracellular staining (B). (A) Quantitation of IFN-γ, IL-4, IL-5, and IL-10 by ELISA. Error bars indicate SD. The data shown are representative of four experiments. (B) Intracellular IFN-γ, IL-4, and IL-10 staining of T cells cultured with HSV-DCs. The percentages in each quadrant are indicated on the plot. The data shown are representative of three experiments. (C) IFN-γ and IL-10 production by T cells cultured with HSV-DCs in the presence of neutralizing anti–IL-12 mAb and/or a mixture of anti–IFN-α, anti–IFN-β, and IFN-α/β receptor Abs. The same concentration of anti–IL-12 mAb inhibited IFN-γ production by T cells cultured with anti-CD3, anti-CD28, and 10 ng/ml IL-12 (data not shown). Error bars indicate SD. The data shown are representative of three experiments.

References

    1. Fearon D.T., Locksley R.M. The instructive role of innate immunity in the acquired immune response. Science. 1996;272:50–53. - PubMed
    1. Medzhitov R., Janeway C.A., Jr. Innate immunityimpact on the adaptive immune response. Curr. Opin. Immunol. 1997;9:4–9. - PubMed
    1. Sallusto F., Lanzavecchia A. Efficient presentation of soluble antigen by cultured human dendritic cells is maintained by granulocyte/macrophage colony-stimulating factor plus interleukin 4 and downregulated by tumor necrosis factor alpha. J. Exp. Med. 1994;179:1109–1118. - PMC - PubMed
    1. Sallusto F., Cella M., Danieli C., Lanzavecchia A. Dendritic cells use macropinocytosis and the mannose receptor to concentrate macromolecules in the major histocompatibility complex class II compartmentdownregulation by cytokines and bacterial products. J. Exp. Med. 1995;182:389–400. - PMC - PubMed
    1. Cella M., Engering A., Pinet V., Pieters J., Lanzavecchia A. Inflammatory stimuli induce accumulation of MHC class II complexes on dendritic cells. Nature. 1997;388:782–787. - PubMed

Publication types