

Review
doi: 10.1105/tpc.12.7.1021.
Comparative sequence analysis of plant nuclear genomes:m microcolinearity and its many exceptions
Affiliations
- PMID: 10899971
- PMCID: PMC149046
- DOI: 10.1105/tpc.12.7.1021
Item in Clipboard
Review
Comparative sequence analysis of plant nuclear genomes:m microcolinearity and its many exceptions
Plant Cell.
2000 Jul.
No abstract available
Figures
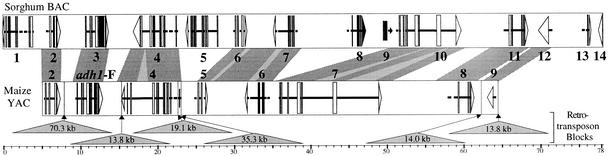
Comparison of adh-Orthologous Regions of Sorghum and Maize. Numbers above the bars indicate genes that are homologous to cDNAs or genomic genes from plants and other species. The arrows within the bars show genes, including exons (thick) and introns (thin), and their apparent transcriptional orientation. The shading between the two bars indicates regions with extensive sequence identity. The lower bar has been greatly shortened (∼80%) by removal of the numerous blocks of nested LTR retrotransposons (SanMiguel et al., 1996, 1998) represented by triangles below the bar. This figure is based on data and analyses generated by Tikhonov et al. (1999). BAC, bacterial artificial chromosome; YAC, yeast artificial chromosome.
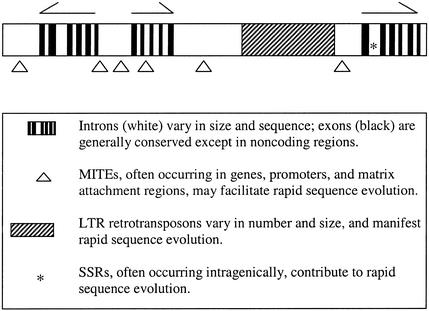
A Model for the Genic Regions of Plant Genomes. Arrows above the bar indicate genes (with exons represented by black vertical lines below each gene) and their directions of transcription. The cross-hatched region represents an LTR retrotransposon block. The frequency and sizes of these blocks appear to be quite variable between genomes and perhaps between regions of the same genome. Other features of the model are described in the key. A simple sequence repeat (SSR) is represented by an asterisk.
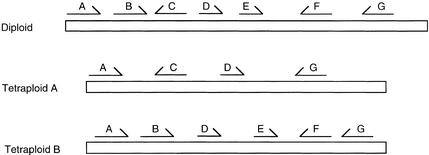
A Model for Orthologous Gene Relationships in a Diploid and Its Tetraploid Relative. Genes are indicated by arrows, and ortholog representations share common letters. In this model, all of the ancestral genes are present in the diploid region depicted, but three genes (two apparent events) have been deleted in generation of the tetraploid A genome and one gene from the tetraploid B genome. Note that copies of all of the genes are retained in the degenerating tetraploids, but some genes (e.g., B, C, E, and F) are now present only as diploid loci.
References
-
- Ahn, S., Anderson, J.A., Sorrells, M.E., and Tanksley, S.D. (1993). Homoeologous relationships of rice, wheat and maize chromosomes. Mol. Gen. Genet. 241, 483–490. - PubMed
-
- Arumuganathan, K., and Earle, E.D. (1991). Nuclear DNA content of some important plant species. Plant Mol. Biol. Rep. 9, 208–218.
-
- Avramova, Z., Tikhonov, A., SanMiguel, P., Jin, Y.-K., Liu, C., Woo, S.-S., Wing, R.A., and Bennetzen, J.L. (1996). Gene identification in a complex chromosomal continuum by local genomic cross-referencing. Plant J. 10, 1163–1168. - PubMed
-
- Bennett, M.D., and Leitch, I.J. (1995). Nuclear DNA amounts in angiosperms. Ann. Bot. 76, 113–176.
Publication types
MeSH terms
LinkOut - more resources
Full Text Sources
