. 2000 Jul 18;97(15):8578-83.
doi: 10.1073/pnas.97.15.8578.

Calcium imaging demonstrates colocalization of calcium influx and extrusion in fly photoreceptors

Affiliations

Calcium imaging demonstrates colocalization of calcium influx and extrusion in fly photoreceptors

J Oberwinkler et al. Proc Natl Acad Sci U S A. .

Abstract

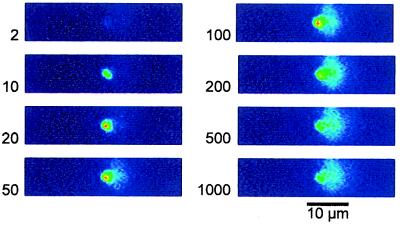
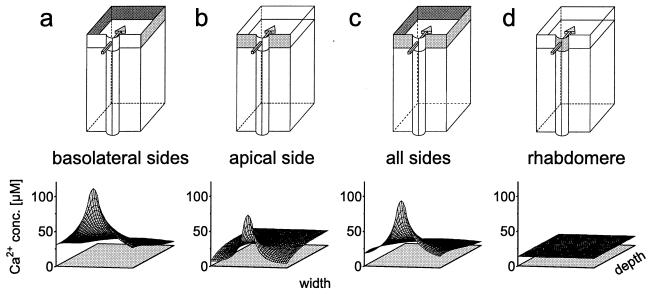
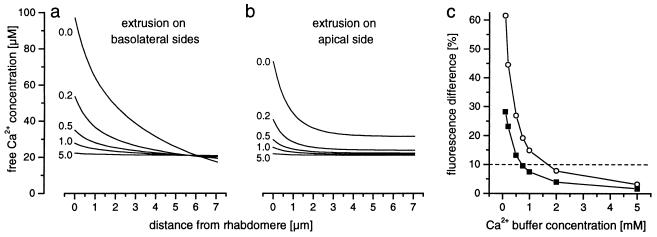
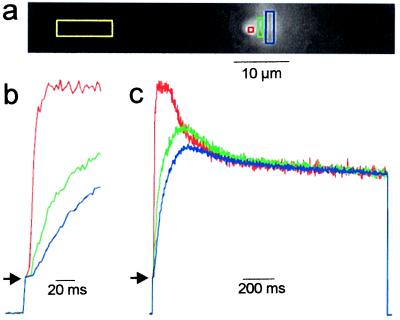
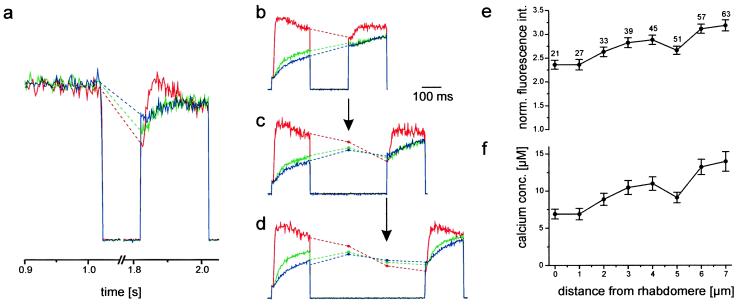
During illumination, Ca(2+) enters fly photoreceptor cells through light-activated channels that are located in the rhabdomere, the compartment specialized for phototransduction. From the rhabdomere, Ca(2+) diffuses into the cell body. We visualize this process by rapidly imaging the fluorescence in a cross section of a photoreceptor cell injected with a fluorescent Ca(2+) indicator in vivo. The free Ca(2+) concentration in the rhabdomere shows a very fast and large transient shortly after light onset. The free Ca(2+) concentration in the cell body rises more slowly and displays a much smaller transient. After approximately 400 ms of light stimulation, the Ca(2+) concentration in both compartments reaches a steady state, indicating that thereafter an amount of Ca(2+), equivalent to the amount of Ca(2+) flowing into the cell, is extruded. Quantitative analysis demonstrates that during the steady state, the free Ca(2+) concentration in the rhabdomere and throughout the cell body is the same. This shows that Ca(2+) extrusion takes place very close to the location of Ca(2+) influx, the rhabdomere, because otherwise gradients in the steady-state distribution of Ca(2+) should be measured. The close colocalization of Ca(2+) influx and Ca(2+) extrusion ensures that, after turning off the light, Ca(2+) removal from the rhabdomere is faster than from the cell body. This is functionally significant because it ensures rapid dark adaptation.


Figures

Figure 1
Figure 1
A time series of images showing the Ca2+-induced fluorescence of the low-affinity dye OG5N during light stimulation. Raw intensity images are plotted by using false-color coding. Two milliseconds after the light was turned on, the first image was recorded. It represents the initial level of fluorescence during the latency period of the cell, because of autofluorescence of the tissue and the residual fluorescence of the Ca2+ indicator at low Cai. The other images are taken at times indicated by the numbers (in milliseconds). Ten milliseconds after the onset of illumination, a strong increase in fluorescence is visible in the region that corresponds to the rhabdomere. The fluorescence signal in the rhabdomere starts to decline after 100 ms, and it spreads into the cell body.
Figure 2
Figure 2
Calculated distribution of Cai in a cross section of a square model cell. The continuous influx is assumed to occur at a 1.5-μm-wide region of one side (arrow in the diagrams). Extrusion is modeled at different regions of the plasma membrane, as indicated in the diagrams by the gray shading. (a) Ca2+ extrusion only at the basolateral sides. (b) Ca2+ extrusion only at the apical side, the Ca2+ influx region (rhabdomere) excluded. (c) Ca2+ extrusion at all sides, but the Ca2+ influx region excluded. (d) Ca2+ extrusion only at the Ca2+ influx region. In a–c, the resulting distribution of Cai shows large gradients, but not in d.
Figure 3
Figure 3
The concentration of the Ca2+ buffer strongly influences the modeled distribution of the free Ca2+ concentration. (a and b) The free Ca2+ concentration profile along the symmetry line through the cell body, from the Ca2+ influx region to the opposite side of the cell body, is plotted. The extrusion was assumed to take place only at basolateral sides (a; as in Fig. 2a) or only at the apical side (b; as in Fig. 2b). Increasing the buffer concentration (indicated by the numbers, in millimolars) reduces the size of the predicted gradients. (c) The relative fluorescence intensity difference of a Ca2+ indicator with Kd = 20 μM between the Ca2+ influx region (x = 0 μm in a and b) and the opposite end of the cell body (x = 7.1 μm in a and b) is plotted as a function of the buffer concentration, when assuming extrusion on the basolateral sides (○) or on the apical side (▪). Below a buffer concentration of 0.75 mM, the fluorescence intensity between the two points differs by more than 10% (dashed line).
Figure 4
Figure 4
The steady-state distribution of Cai in a cross section of a photoreceptor cell is homogeneous. (a) Raw intensity image (gray scale) of 100 successive images averaged during the steady state. The colored squares indicate the regions of interest quantitatively analyzed in b and c; red, rhabdomere; green, center of cell; blue, side of cell opposite the rhabdomere; yellow, background, outside the cell that was injected with the Ca2+ indicator. (b and c) Normalized fluorescence traces (the first value obtained after turning on the light was used for normalization; arrows). The normalized fluorescence rises sharply in the rhabdomere (red line) and displays a large transient. After the decay of the transient, the normalized fluorescence shows the same values, independent of location of the region of interest. The distribution of Cai during the steady state thus is homogeneous. The traces are averages of five experiments.
Figure 5
Figure 5
Ca2+ extrusion is faster in the rhabdomere than in the rest of the cell. (a) After 1 s of light stimulation (of which the last 100 ms are shown), which allowed Cai to reach a homogeneous steady state (as in Fig. 4), the cell was dark adapted for 800 ms. After this dark period, the reduction of the Cai-induced fluorescence was stronger in the rhabdomere (red trace) than in other parts of the cell (green and blue traces). (b–d) A different cell was stimulated for 200 ms, and the light was then turned off for 200 ms (b), 400 ms (c), or 600 ms (d) and turned on again (for 200 ms) to probe the change of fluorescence, and hence Cai, during the dark period. Again, in the rhabdomere, Ca2+ declines much faster and to lower values than in the cell body. (e) The gradient of Cai at the onset of the second light stimulus in d plotted as normalized fluorescence intensity vs. distance from the rhabdomere. The error bars give the SEM obtained by averaging over the amount of pixels indicated by the numbers. (f) From the normalized fluorescence traces, the Cai values were calculated as described in ref. by assuming Fmax = 6.3, Fmin = 1, and Kd = 20 μM (29, 30). The traces were averaged 10 (a), 5 (b), 2 (c), and 6 (d) times.

References

    1. Koch C, Zador A. J Neurosci. 1993;13:413–422. - PMC - PubMed
    1. Lenzi D, Roberts W M. Curr Opin Neurobiol. 1994;4:496–502. - PubMed
    1. Augustine G J, Neher E. Curr Opin Neurobiol. 1992;2:302–307. - PubMed
    1. Hardie R C, Minke B. Neuron. 1992;8:643–651. - PubMed
    1. Reuss H, Mojet M H, Chyb S, Hardie R C. Neuron. 1997;19:1249–1259. - PubMed

LinkOut - more resources