. 2000 Aug 1;20(15):5594-607.
doi: 10.1523/JNEUROSCI.20-15-05594.2000.

Efficacy and stability of quantal GABA release at a hippocampal interneuron-principal neuron synapse

Affiliations

Efficacy and stability of quantal GABA release at a hippocampal interneuron-principal neuron synapse

U Kraushaar et al. J Neurosci. .

Abstract

We have examined factors that determine the strength and dynamics of GABAergic synapses between interneurons [dentate gyrus basket cells (BCs)] and principal neurons [dentate gyrus granule cells (GCs)] using paired recordings in rat hippocampal slices at 34 degrees C. Unitary IPSCs recorded from BC-GC pairs in high intracellular Cl(-) concentration showed a fast rise and a biexponential decay, with mean time constants of 2 and 9 msec. The mean quantal conductance change, determined directly at reduced extracellular Ca(2+)/Mg(2+) concentration ratios, was 1.7 nS. Quantal release at the BC-GC synapse occurred with short delay and was highly synchronized. Analysis of IPSC peak amplitudes and numbers of failures by multiple probability compound binomial analysis indicated that synaptic transmission at the BC-GC synapse involves three to seven release sites, each of which releases transmitter with high probability ( approximately 0.5 in 2 mm Ca(2+)/1 mm Mg(2+)). Unitary BC-GC IPSCs showed paired-pulse depression (PPD); maximal depression, measured for 10 msec intervals, was 37%, and recovery from depression occurred with a time constant of 2 sec. Paired-pulse depression was mainly presynaptic in origin but appeared to be independent of previous release. Synaptic transmission at the BC-GC synapse showed frequency-dependent depression, with half-maximal decrease at 5 Hz after a series of 1000 presynaptic action potentials. The relative stability of transmission at the BC-GC synapse is consistent with a model in which an activity-dependent gating mechanism reduces release probability and thereby prevents depletion of the releasable pool of synaptic vesicles. Thus several mechanisms converge on the generation of powerful and sustained transmission at interneuron-principal neuron synapses in hippocampal circuits.


Figures
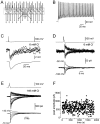
Fig. 1.
Fig. 1.
Unitary IPSPs and IPSCs at the BC–GC synapse in the paired recording configuration. A, Schematic illustration of the BC–GC microcircuit in the dentate gyrus.B, High-frequency train of action potentials evoked in a putative BC by a current pulse (200 msec, 1.4 nA). C, Unitary IPSPs recorded from a BC–GC pair at −30 mV with 6 mm intracellular Cl concentration. Single presynaptic action potential evoked by a depolarizing current pulse in the BC is shown on top, single IPSPs are shown superimposed in the center, and average IPSP is depicted at the bottom. D, Unitary IPSCs in a BC–GC pair with 6 mm intracellular Clconcentration. Single presynaptic action potential is shown ontop, single IPSCs at −100 and −50 mV are shown superimposed in the center, and average IPSCs at −100 to −50 mV (10 mV increment) are depicted at the bottom.E, Unitary IPSCs in a BC–GC pair with 149 mm intracellular Cl concentration. Single presynaptic action potential is shown on top, single IPSCs at −100 and +30 mV are shown superimposed in thecenter, and average IPSCs at −70 to +30 mV (20 mV increment) are depicted at the bottom. F, Unitary IPSC peak amplitude plotted against recording time. Note that the amplitude was stationary (correlation coefficientr = 0.05, p > 0.1). Averages are from 30–100 single synaptic events. Data inCF are from different pairs. Pair shown in F is pair #1 in Table 2.
Fig. 2.
Fig. 2.
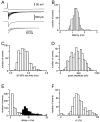
Amplitude and time course of the unitary postsynaptic conductance change at the BC–GC synapse. Data are from a single pair. A, Presynaptic action potential (top), single unitary IPSCs (9 sweeps superimposed), average IPSC (from 60 sweeps), and sum of two exponentials fitted to the average IPSC (bottom, with individual components) are depicted. B, Latency, measured from the steepest point in the rising phase of the presynaptic action potential to the onset of the first IPSC in a trace. C, Rise time (20–80%) of unitary IPSCs. D, Peak amplitude of unitary IPSCs. Thirty-one failures are not displayed. E, Decay time constants of unitary IPSCs: fast decay time constant τ1 (open bars); slow decay time constant τ2 (filled bars). F, Amplitude contribution of the fast component of decay (A1) obtained by biexponential fit. Extracellular Ca2+ and Mg2+ concentrations were 2 and 1 mm, respectively. Holding potential was −70 mV; intracellular Cl concentration in the postsynaptic GC was 149 mm. All data are from the same BC–GC pair.
Fig. 3.
Fig. 3.
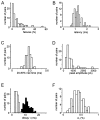
Amplitude and time course of the unitary postsynaptic conductance change at the BC–GC synapse. Summary graphs of data from 78 pairs. A, Percentage of failures of transmission. B, Mean first latency. C, Mean 20–80% rise time. D, Mean peak amplitude of average IPSCs (including failures). E, Mean decay time constants: fast decay time constant τ1 (open bars); slow decay time constant τ2(filled bars). F, Mean amplitude contribution of the fast component of decay (A1). Extracellular Ca2+ and Mg2+ concentrations were 2 and 1 mm, respectively. Holding potential was −70 mV; intracellular Cl concentration in the postsynaptic granule cells was 149 mm in all experiments.
Fig. 4.
Fig. 4.
Direct recording of quantal IPSCs at the BC–GC synapse. A, B, Unitary IPSCs at physiological Ca2+/Mg2+concentrations (A) (2 mmCa2+, 1 mm Mg2+) and after reduction of release probability (B) (0.5 mm Ca2+, 2.5 mmMg2+). Six traces are shown superimposed ontop; average IPSCs including failures are shown at thebottom. C, Percentage of failures plotted against the extracellular Ca2+ concentration.D, Mean peak amplitude of successful IPSCs (excluding failures) plotted against extracellular Ca2+ concentration. Error bars indicate SD of IPSC amplitudes. Open circles indicate experiments in which the Mg2+ concentration was kept constant (3 or 4 mm); filled circles represent experiments in which the sum of Ca2+ and Mg2+concentrations was maintained (3 mm). As the Ca2+ concentration was reduced, the number of failures increased, but the amplitude of the successful IPSCs approached asymptotically a minimal value. This suggests that IPSCs at Ca2+ concentrations below 0.5 mm are mainly quantal IPSCs. Data in C and D are from 11 pairs; data obtained from the same pair were connected bydashed lines.
Fig. 5.
Fig. 5.
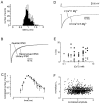
Time course of quantal release at the BC–GC synapse. A, First latency distribution (filled bars) and time course of quantal release (open bars) in a BC–GC pair, calculated from first latencies using the correction method of Barrett and Stevens (1972). Data were obtained with 0.5 mm Ca2+ and 2.5 mm Mg2+ in the bath; data are from 299 IPSCs (401 failures). B, Average unitary IPSC in 0.5 mm Ca2+, 2.5 mmMg2+, average quantal IPSC (obtained after aligning single events on their rising phase), and a simulated IPSC generated by reconvolution of the time course of quantal release with the time course of the quantal conductance change are shown superimposed. Thethree traces were normalized to the same peak value.C, Mean time course of quantal release. Histograms of the time course of release were aligned to the bin with the maximal number of events (nmax, which is represented as time 0 in the graph). Numbers of events were normalized by nmax and plotted logarithmically. The line represents the results of linear regression of the decay, yielding a decay time constant of 0.23 msec. Data are from four pairs. D, Average unitary IPSCs in 2 mm Ca2+/1 mmMg2+ and 0.5 mmCa2+/2.5 mm Mg2+, normalized to the same peak amplitude value, are shown superimposed. The absolute peak amplitudes were 612 and 164 pA, respectively.E, Plot of the decay time constants against extracellular Ca2+ concentration: fast decay time constant τ1 (open symbols), slow decay time constant τ2 (filled symbols); different symbol shape indicates different pairs (12 total). Thegraph illustrates that the decay time course of the IPSCs is only weakly dependent on extracellular Ca2+concentration. F, Plot of the decay time constants (mean value of the two time constant values weighted with the respective amplitude contribution) of single unitary IPSCs in four pairs against the peak amplitudes. Both weighted time constant and amplitude were normalized to the mean value in the recorded ensemble.Line represents the results of linear regression. No significant correlation between time constant and amplitude was apparent (p > 0.1). Data inA, B, and D are from the same pair.
Fig. 6.
Fig. 6.
Estimation of the number of functional release sites and the release probability using multiple probability compound binomial analysis. A, Peak amplitude distributions from a pair in 2 mm Ca2+/1 mmMg2+ (a) and 0.5 mm Ca2+/2.5 mmMg2+ (b). The thick curve represents the total probability density function (ΣPi(x)); thethin curves represent individual components (P1(x) −P7(x)) as obtained by maximum-likelihood fit. For model parameters, see Table 2, pair #1. Failures are not depicted; measured numbers of failures were 1 (a) and 430 (b), and predicted numbers of failures were 1 (a) and 429 (b). B, Similar analysis for a different pair (#3) in 2 mm Ca2+/1 mm Mg2+ (a) and 0.5 mm Ca2+/2.5 mmMg2+ (b). Measured numbers of failures were 13 (a) and 731 (b), and predicted numbers of failures were 8 (a) and 729 (b).C, Results of bootstrap analysis for the number of functional release sites (left) and the release probabilities in the two conditions (right) for pair #1 (a) and pair #3 (b). Bootstrap replications (100) of the original data set were fitted in a manner identical to the original data set, and the distributions of estimated number of release sites and release probabilities (in 2 mm Ca2+/1 mmMg2+ and 0.5 mmCa2+/2.5 mm Mg2+, respectively) were plotted. For details, see Materials and Methods.D, Plot of estimated mean release probability <p> against extracellular Ca2+concentration for the five pairs shown in Table 2. Data were fitted with a Hill equation f(c) =pmax [1 + (EC50/c)n]1, with maximal release probability pmax = 0.79, EC50 = 1.5 mm, and apparent Hill coefficient n = 2.4, where c denotes the extracellular Ca2+ concentration.
Fig. 7.
Fig. 7.
Properties of PPD of IPSCs at the BC–GC synapse. A, IPSCs evoked by pairs of action potentials in the presynaptic BC, separated by intervals of variable duration.Traces shown are averages of 30 unitary IPSCs and were normalized to the same amplitude for the first average IPSC (absolute values of A1 were 1393, 1180, and 1216 pA, respectively). B, Time course of recovery from PPD. The ratio of amplitudes of the second (A2) and the first (A1) unitary IPSC, both measured from their respective baselines as indicated in A, was plotted against the interpulse interval. The curverepresents a fitted exponential function with a time constant of 1.97 sec. Number of pairs is indicated in parentheses above the data points. C, Coefficient of variation analysis suggests a presynaptic locus of PPD. The inverse of the square of the coefficient of variation of A2(CV2) was plotted against the mean peak amplitude; data were normalized by the CV2 and mean, respectively, of A1. Data are from 10 pairs. Intervals between presynaptic action potentials were 100 msec (▾), 500 msec (▿), 1 sec (▪), 2 sec (■), and 3 sec (♦).Curve a represents the prediction of Equation 8 of Silver et al. (1998) for a pure change in release probability psuperimposed on the data points (number of release sites = 5, release probability = 0.53, CV1 = 0.18, CV2 = 0.34; no variation in p).Curve e represents the prediction of a pure change in quantal size q, and curves bd show predictions for mixed changes (75, 50, and 25% contribution of changes in p, withp = xaand q =x1-a, where a is the fractional contribution of the change in p andx is the normalized mean). D, PPD appears to be independent of presynaptic GABAB receptor activation.Left, Average IPSCs in control conditions (top) and in the presence of 5 μmCGP55845A in the bath solution (center) are depicted, together with a superposition of both traces (bottom).Right, Summary bar graph of meanA2/A1 in control conditions and in the presence of CGP55845A. Extracellular Ca2+ and Mg2+ concentrations were 2 and 1 mm, respectively. Interpulse interval, 100 msec. Failures included in all averages. Number of pairs indicated inparentheses above the bars.
Fig. 8.
Fig. 8.
PPD at the BC–GC synapse appears to be independent of release probability and previous exocytosis.A, PPD is independent of extracellular Ca2+ concentration. Left, Average IPSCs in 4 mm Ca2+/0.5 mmMg2+ (top) or 0.5 mmCa2+/4 mm Mg2+(center) are depicted (failures included), together with a superposition of both traces after normalization to give the same peak amplitude for the first average IPSC (bottom).Right, Mean A2/A1(open bars) and percentage of failures (filled bars) for 0.5 and 3 mm  Ca2+/3 mm Mg2+. Interpulse interval, 100 msec. Number of pairs indicated in parentheseson top. B, PPD appears to be independent of previous release. Plot of A2 againstA1 for individual events is shown. Amplitudes were normalized to the mean A1 in the recorded ensemble. Line represents the results of linear regression. No significant correlation between IPSC peak amplitudes was apparent (p > 0.05); interpulse interval, 100 msec. Data were from 10 pairs; different pairs are represented by different symbols.
Fig. 9.
Fig. 9.
Depression of IPSCs at the BC–GC synapse during multiple-pulse stimulation. A, Unitary IPSCs during a 20 Hz train of 1000 action potentials; stimulation frequency before and after the train was 0.25 Hz. Presynaptic action potentials (top) were truncated. B, Unitary IPSCs at an expanded time scale from the same pair as shown in Ain control conditions (top), at the end of the 20 Hz train (center), and after recovery (bottom). C, Onset of depression during a 20 Hz train. Each data point represents the mean IPSC peak amplitude in 23 pairs, normalized to the mean peak amplitude at 0.25 Hz before the train. D, Plot of mean unitary IPSC peak amplitudes (action potentials 851–900, failures included) against stimulation frequency, normalized to the control value (at 0.25 Hz). Number of pairs indicated in parentheses above the data points.E, Recovery from depression induced by a 20 Hz train. Each data point represents the mean peak amplitude from one (first point) or three (all following points) consecutive IPSCs in 23 pairs, normalized to the mean peak amplitude at 0.25 Hz after complete recovery from depression (which, on average, was 1.05-fold larger than that before the train, indicating a slight post-tetanic potentiation).F, Coefficient of variation analysis of short-term depression. The inverse of the square of the CV of the peak amplitude of unitary IPSCs (action potentials 851–900) was plotted against the mean peak amplitude for different frequencies; data were normalized by the CV2 and mean, respectively, of IPSCs evoked at 0.25 Hz. Stimulation frequency was 1 Hz (●), 2 Hz (○), 10 Hz (▾), 20 Hz (▿), 40 Hz (▪), and 50 Hz (■).Curve a represents the prediction of Equation 8 ofSilver et al. (1998) for a pure change in p superimposed on the data points (with same parameters as in Fig. 7). Curve e represents the prediction of a pure change inq, and curves b–d show predictions for mixed changes (75, 50, and 25% contribution of changes inp). G, Onset of depression during a 20 Hz train in the presence of 5 μm CGP55845A. Each data point represents the mean peak amplitude in seven pairs, normalized to the mean peak amplitude at 0.25 Hz before the train. H, The slow component of depression appears to be dependent on release probability. Onset of depression during 20 Hz trains in 0.5 mm Ca2+/2.5 mmMg2+ (9 pairs, ○) and 2 mmCa2+/1 mm Mg2+ (●). Each data point represents the mean peak amplitude, normalized to the mean peak amplitudes at 0.25 Hz before the train. I, Correlation of peak amplitudes of consecutive IPSCs in the late portion of 20 Hz trains (last 500 action potentials) in 2 mmCa2+/1 mm Mg2+. Peak amplitudes An+1 of IPSCs (or failures) were plotted against the amplitudes An of the directly preceding IPSCs (or failures), both normalized to the mean amplitude of the data set. Eleven of 11500 points are located outside the plot range. Line represents the results of linear regression. A slight but significant negative correlation between IPSC peak amplitudes was apparent (slope −0.054; p < 0.001). Extracellular Ca2+ and Mg2+concentrations were 2 and 1 mm, respectively, in all cases except H. Time 0 in C, E,G, and H indicates the time of change in frequency. SEMs in C, G, andH were not shown for clarity. Continuous curves in CE and Hrepresent the predictions of a two-pool model with activity-dependent reduction in release probability fitted to the data points (Fig.10).
Fig. 10.
Fig. 10.
Activity-dependent gating of release may prevent depletion of the releasable pool of synaptic vesicles.A, Schematic illustration of different vesicular pool models. Univesicular release constraint. The capacity of the releasable pool (Nv0) was assumed as 50, the initial release probability (pR at time 0) as 0.5, and the refilling rate as k = 0.01 sec1. a, Two-pool model with constant rates. b, Two-pool model with activity-dependent reduction in release probability (Betz, 1970). Activity-dependent reduction of pR was defined by amax = 1, α = 0.2, and β = 2 sec1, yielding a half-maximal activating frequency at 10 Hz and a maximal time constant of 0.5 sec. c, Two-pool model with activity-dependent refilling of the releasable pool (Kusano and Landau, 1975). Activity-dependent increase of k was defined byamax = 4, α = 0.2, and β = 2 sec1. The frequency dependence of the reduction and enhancement factor, respectively, in steady-state conditions is illustrated adjacent to the affected rate.B, Mean release probabilitypR during 20 Hz trains, normalized to the initial value. Dotted curve indicates modela; continuous curve, modelb; dashed curve, model c. The shaded area indicates the gain of IPSC amplitude in the late phase of the train, generated by redistribution of release events from the early to the late phase. Note that the prediction of model b is consistent with the time course of onset of multiple-pulse depression. Furthermore, model bpredicts a maximal paired-pulse depression of 1-(Nv0pR)/Nv0exp(−α) = 0.19, whereas models a andc give a much smaller depression 1-(Nv0pR)/Nv0= 0.01. Model b was also used to fit the experimental data in Figure 9, CE andH. The initial release probabilitiespR were constrained to 0.526 and 0.049, respectively, which were the mean release probabilities in 2 mm Ca2+/1 mmMg2+ and 0.5 mmCa2+/2.5 mmMg2+ during low-frequency stimulation (Fig.6D, Table 2). The best-fit parameters were as follows: capacity of the releasable poolNv0 = 51 vesicles per site, refilling rate k = 0.059 sec1, maximal activity-dependent modification amax = 0.59, and rates of α = 0.36 and β = 3.9 sec1, yielding a half-maximal inhibitory frequency of 10.7 Hz and a maximal time constant of 0.26 sec of the activity-dependent process. For details, see Materials and Methods.

Similar articles

Cited by

References

    1. Auger C, Kondo S, Marty A. Multivesicular release at single functional synaptic sites in cerebellar stellate and basket cells. J Neurosci. 1998;18:4532–4547. - PMC - PubMed
    1. Barbour B, Häusser M. Intersynaptic diffusion of neurotransmitter. Trends Neurosci. 1997;20:377–384. - PubMed
    1. Barrett EF, Stevens CF. The kinetics of transmitter release at the frog neuromuscular junction. J Physiol (Lond) 1972;227:691–708. - PMC - PubMed
    1. Bellingham MC, Walmsley B. A novel presynaptic inhibitory mechanism underlies paired pulse depression at a fast central synapse. Neuron. 1999;23:159–170. - PubMed
    1. Betz WJ. Depression of transmitter release at the neuromuscular junction of the frog. J Physiol (Lond) 1970;206:629–644. - PMC - PubMed

Publication types

LinkOut - more resources