. 2000 Aug 1;20(15):5764-74.
doi: 10.1523/JNEUROSCI.20-15-05764.2000.

Differential modulation of proliferation in the neocortical ventricular and subventricular zones

Affiliations

Differential modulation of proliferation in the neocortical ventricular and subventricular zones

T F Haydar et al. J Neurosci. .

Abstract

Recent studies have implicated the classical neurotransmitters GABA and glutamate in the regulation of neural progenitor proliferation. We now show that GABA and glutamate have opposite effects on the two neural progenitor populations in the ventricular zones (VZs) and subventricular zones (SVZs) of the embryonic cerebrum. Application of either molecule to organotypic slice cultures dramatically increases proliferation in the VZ by shortening the cell cycle, whereas proliferation in the SVZ is decreased. These disparate effects, measured both by bromodeoxyuridine uptake and the expansion of retrovirally labeled progenitor clones, are mimicked by the application of specific GABA and glutamate agonists and are blocked by antagonists. Thus, the relative contributions of the VZ and SVZ to neocortical growth may be regulated by differential responsiveness to GABA and glutamate.


Figures

Fig. 1.
Fig. 1.
VZ cells in the organotypic slices undergo interkinetic migration as they progress through the cell cycle.A, Cells in S-phase form an abventricular BrdU+ band in the VZ after 1 hr labeling with BrdU (surface of lateral ventricle is at bottom).B, After 8 hr of cumulative BrdU labeling, many originally labeled S-phase cells have migrated to the apical surface of the VZ and are dividing. In addition, as more unlabeled cells enter S-phase and incorporate BrdU, the VZ begins to fill with BrdU+ cells. C, E, After 1 hr of BrdU labeling, flow cytometric analysis shows BrdU+ cells in S-phase of the cell cycle. Cells in S-phase for the entire period of labeling have a high DNA content, whereas cells in S-phase for a short period of time have lower DNA content. D,F, After 8 hr of labeling, BrdU+ cells are spread throughout the cell cycle. Some cells that were labeled at the end of S-phase have progressed through mitosis and are now in G1/G0 phase.
Fig. 2.
Fig. 2.
GABA and glutamate increase proliferation in the VZ. A, In slices cultured at E13, the LI rises steadily in control slices (black lines) as VZ cells progress through the cell cycle and are labeled with BrdU. In contrast, the LI curves for GABA (30 μm)- and glutamate (50 μm)-treated slices (red and blue lines, respectively) rise with a steeper slope, indicating that the cell cycle is faster in treated slices. B,Similarly, the cell cycle of GABA- and glutamate-treated slices is shorter than controls at E14. C, The addition of GABA and glutamate agonists to E14 slice cultures also increases the rate of VZ proliferation (compare to black curve inB). D, Conversely, the GABA and glutamate antagonists BMI (10 μm) and CNQX (10 μm) tend to prolong the duration of the cell cycle. Interestingly, addition of CNQX to the slices increases the duration of the cell cycle when compared to controls (black curve inB).
Fig. 3.
Fig. 3.
GABA and glutamate increase VZ cluster size.A,B, Because progenitors had only enough time to divide once under control conditions (Table 1), the number of pLIA-infected cells per cluster 24 hr after retroviral infection of E13 embryonic brains was one cell per cluster. Image in Ashows a retroviral-infected VZ progenitor dividing at the surface of the lateral ventricle. C, D, By 48 hr after infectionin vivo, infected cells cultured under control conditions had divided two or three times yielding two or four cells per cluster. Inset in C shows the cells in this cluster at higher magnification. E, F, In control slice cultures made 24 hr after in vivoretroviral infection on E13 and then cultured for an additional 24 hr, there were one or two cells per cluster. G,H, GABA or (I andJ) glutamate application during the slice incubation caused VZ progenitors to divide more quickly, increasing the number of VZ cells/cluster to two or four cells.
Fig. 4.
Fig. 4.
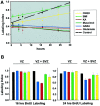
GABA and glutamate decrease SVZ proliferation.A, The LI in the E14 control slice SVZ increases steadily over time as more cells enter S-phase and incorporate BrdU (dashed line). The GABA and glutamate antagonists BMI and CNQX also caused positive slopes in the SVZ LI curves (green and yellow lines, respectively). In contrast, GABA, glutamate, and their agonists all cause no increase in the number of BrdU+ SVZ cells over time, suggesting that SVZ proliferation is inhibited in response to GABA and glutamate. B, At 16 and 24 hr of cumulative BrdU labeling in E14 slices, no difference in LI is seen in the VZ between control, GABA-, glutamate-, and antagonist-treated slices. In contrast, when the VZ and SVZ LIs at 16 and 24 hr are pooled, GABA and glutamate decrease the combined LI and BMI and CNQX block this decrease. Thus, GABA and glutamate have an overall inhibitory affect on progenitor proliferation when the VZ and SVZ are analyzed together.
Fig. 5.
Fig. 5.
Postmitotic cell generation is inhibited by GABA and glutamate. The number of BrdU+ cells from 24 or 48 hr cumulative labeling experiments that had migrated into the neocortical wall above the SVZ were recorded for slices cultured on E14. After 24 hr, few BrdU+ cells in control slices (black bar) had exited the cell cycle and migrated away from the VZ and SVZ. Similarly, few cells in GABA-treated slices had exited the proliferative zones even though VZ cells in treated slices (gray bar) had progressed through two cell cycles compared to the one cell cycle in controls (Table 2). After 48 hr and two VZ cell cycles of labeling, many BrdU+ cells had exited the proliferative zones in controls (black bar). In contrast, 80% fewer cells had migrated out of the proliferative zones in GABA- (gray bar) and glutamate- (striped bar) treated slices over the four cell cycles under those conditions (Table 2). *p < 0.01.
Fig. 6.
Fig. 6.
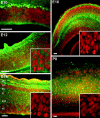
GABA distribution during neurogenesis. The extracellular distribution of GABA (green) was assessed by immunohistochemistry throughout prenatal neocortical development. The presence of diffuse staining in the proliferative zones is initially high during early neurogenesis (E10–E14), but then gradually diminishes during the remainder of neurogenesis (E14–P0). The panel insets are confocal images of propidium iodide and GABA staining in the VZ at the respective ages. Each section is counterstained with the DNA stain propidium iodide (red) to demarcate the layers of the neocortical wall. The ventricular surface of each section is at the bottom of the image.Inset for P0 pictures the subependymal zone.VZ, Ventricular zone; SVZ, subventricular zone; IZ, intermediate zone; SP, subplate; CP, cortical plate; MZ, marginal zone. Scale bar, 50 μm.
Fig. 7.
Fig. 7.
Glutamate distribution during neurogenesis. The distribution of glutamate (green) during the period of neocortical neurogenesis was examined using immunohistochemistry. Diffuse staining throughout the neocortical wall was present at E12 and E14, but the comparative levels of glutamate staining in the proliferative zones subsided thereafter. On E16 and E18, high amounts of staining were only present in the marginal zone, subplate, and intermediate zone. Each section was counterstained with propidium iodide (red) to elucidate the layers of the neocortical wall. The ventricular surface of each section is at thebottom of each image. Scale bar, 50 μm.
Fig. 8.
Fig. 8.
Proliferative gradients during neocortical histogenesis. Levels of GABA and glutamate (grayscale gradient) in the proliferative zones are high at the start of neurogenesis when VZ cells proliferate rapidly (long dashed line) and tend to reenter the cell cycle rather than become neurons, causing a slow rise in the amount of early neurogenesis (solid line). The decrease in GABA and glutamate levels throughout the remainder of the neurogenetic interval is concomitant with slower VZ proliferation, increased production of neurons until the VZ is exhausted of progenitors, and the emergence and predominance of the SVZ as a distinct proliferative compartment (short dashed line).

References

    1. Altman J. Autoradiographic and histological studies of postnatal neurogenesis. IV Cell proliferation and migration in the anterior forebrain, with special reference to persisting neurogenesis in the olfactory bulb. J Comp Neurol. 1969;137:433–458. - PubMed
    1. Antonopoulos J, Pappas IS, Parnavelas JG. Activation of the GABAA receptor inhibits the proliferative effects of bFGF in cortical progenitor cells. Eur J Neurosci. 1997;9:291–298. - PubMed
    1. Bao ZZ, Cepko CL. The expression and function of Notch pathway genes in the developing rat eye. J Neurosci. 1997;17:1425–1434. - PMC - PubMed
    1. Behar TN, Schaffner AE, Scott CA, O'Connell C, Barker JL. Differential response of cortical plate and ventricular zone cells to GABA as a migration stimulus. J Neurosci. 1998;18:6378–6387. - PMC - PubMed
    1. Behar TN, Scott CA, Greene CL, Wen X, Smith SV, Maric D, Liu Q-Y, Colton CA, Barker JL. Glutamate acting at NMDA receptors stimulates embryonic cortical neuronal migration. J Neurosci. 1999;19:4449–4461. - PMC - PubMed

Publication types

MeSH terms